Commercial and Lab Scale Reactors

Download PDF

Introduction

Catalytic reactors are essential tools for evaluating catalyst performance, studying reaction kinetics, and simulating commercial-scale processes. However, selecting or designing the right laboratory reactor can be a complex task. Different research goals require specific reactor types to ensure accurate and meaningful results.

This application note summarizes common laboratory reactor configurations and offers guidance on selecting the appropriate reactor design for catalyst screening, kinetic studies, or process scale-up.

Application 1: Catalyst Screening and Evaluation

Objective: Compare the activity and selectivity of multiple catalyst formulations.

Recommended Reactor Type:

  • Small Fixed-Bed Reactors
  • Simple design and easy fabrication.
  • Requires small catalyst quantities.
  • Operable under isothermal conditions with minimal transport effects.
  • Ideal for detecting trends across a large number of catalysts.
    • Pulse Fixed-Bed Reactors
  • Reactants pulsed periodically over the catalyst bed.
  • Allows quick screening but generates non-steady-state data—careful interpretation required.

Best Practices:
Keep overall conversions low to highlight differences in catalytic activity without masking effects from high conversions.

Application 2: Intrinsic Kinetic Studies

Objective: Obtain kinetic data free from heat and mass transfer limitations.

Recommended Reactor Types:

  • Batch Reactor
  • Continuous Stirred-Tank Reactor (CSTR)
  • Plug-Flow Reactor (PFR)

Most Common Choice:

  • CSTR (Perfectly Mixed Flow Reactor)
  • Reacting mixture has the same composition as the exit stream.
  • Designs include impeller-mixed vessels, externally recirculating systems, and internally recirculating reactors (e.g., Berty and Carberry designs).

Best Practices:

  • Operate under isothermal conditions.
  • Conduct transport limitation tests to confirm kinetic data accuracy.

Application 3: Process Parameter Determination and Scale-Up

Objective: Simulate large-scale reactor conditions to collect process-relevant data.

Recommended Approach:

  • Use the Same Reactor Type as the Commercial Reactor
  • Match phase distribution, catalyst shape, and operating conditions (temperature, pressure, concentrations).
  • Maintain geometrical and operational similarity to the industrial unit.

Best Practices:
Replicate commercial conditions as closely as possible to ensure laboratory data scales accurately.

Summary Table: Reactor Types and Key Characteristics

Reactor Type Ease of Analysis Isothermality Ease of Construction Transport Effects Quality of Data
Fixed-bed, differential P-F G G F P-G
Fixed-bed, integral G P-F G P-F P-F
Pulse P-G G G F P
Batch P G F P P-G
CSTR G G P P-F G
External recirculating G G P P G
Internal recirculating G G P G G
Trickle bed G P P-F P P
Fluidized bed P P P F P-F
Bubble column G G G F F

G = Good, F= Fair, P= Poor

AMI Reactor Solutions

AMI provides a full range of customizable reactor systems for catalyst screening, kinetic studies, and commercial process simulation. Whether you require small-scale fixed-bed units or sophisticated recirculating reactors, AMI’s engineering team can tailor solutions to meet your specific research goals.

References

  • Levenspiel, O., Chemical Reactor Engineering, Wiley (1972).
  • Carberry, J.J., Chemical and Catalytic Reactor Engineering, McGraw-Hill (1976).
  • Rase, H.F., Fixed-Bed Reactor Design and Diagnostics, Butterworths (1990).
  • Turner, J.C.R., in Catalysis Science and Technology, Springer-Verlag (1981).
  • Various studies by Carberry, Berty, Bennett, and Weekman (1964–1974).


Advanced Temperature-Programmed Oxidation (TPO) of Coked Catalysts Using Methanation and FID Detection

Download PDF

Today, advanced techniques such as TEM, Laser Raman Spectroscopy, EELS, ¹³C NMR, and temperature-programmed oxidation (TPO) are widely used to study coked catalysts. Among these, TPO has become one of the most commonly applied methods due to its simplicity and effectiveness.

This Altamira Note discusses the use of TPO combined with an innovative detection method developed by Dr. S.C. Fung and Dr. C.A. Querini at Exxon Research and Engineering Company. This approach is straightforward and enables continuous monitoring of the rate of coke oxidation.

Experimental

In this TPO method, CO₂—a gas to which flame ionization detectors (FID) are typically insensitive—is converted to CH, which is easily detected by an FID. The conversion occurs in the presence of a carrier gas containing oxygen.

For these experiments, an AMI Catalyst Characterization System equipped with a methanator and FID was used. Figure 1 shows the system’s flow diagram.

The methanator consisted of a small reactor filled with a ruthenium catalyst, positioned downstream of the sample U-tube. When hydrogen passed through the methanator, the Ru catalyst quantitatively hydrogenated CO₂ to CH. The FID continuously monitored the rate of CH₄ formation, providing a real-time measurement of the coke oxidation rate.

A GC column was unnecessary because the FID is insensitive to oxygen and water vapor in the gas stream.


For these experiments, approximately 20 mg of coked catalyst were loaded into the sample cell. A helium carrier gas containing a low concentration of oxygen flowed over the sample at a rate of 20–80 cc/min. The temperature was increased linearly from room temperature until the complete oxidation of all carbon deposits.

The methanator contained approximately 500 mg of 40 wt% Ru/zeolite 13X. A pure hydrogen stream was injected into the methanator at a flow rate of 22 cc/min. Under these conditions, CO₂ was quantitatively converted to CH, while the oxygen in the carrier gas was reduced to water. The combined gas stream then flowed directly into the FID.

The FID continuously monitored the methane generation rate, which was equivalent to the rate of coke oxidation.

Influence of Oxygen Concentration, Flow Rate, and Methanator Temperature

Since TPO experiments require an excess of oxygen, it was necessary to evaluate how oxygen concentration affects the hydrogenation of CO₂ to CH and to establish optimal operating conditions. The effects of flow rate and methanator temperature on the hydrogenation efficiency of the ruthenium catalyst were also investigated, along with the impact of various pretreatments on the Ru catalyst’s activity.

To study the influence of oxygen concentration, pulses of 1%, 2%, and 4.26% CO₂ in helium were introduced into the methanator using a pure helium carrier. Additional CO₂ pulses were introduced using helium carriers containing 0.5%, 1%, and 3% oxygen.

As shown in Table 1, the CO₂ pulses were completely converted to CH₄ except when the oxygen concentration was increased to 3%. One possible explanation for this behavior is that water formed in the methanator (due to the oxygen present in the carrier gas) reduced the equilibrium conversion of CO₂ to CH.

CO₂ + 4H₂ → CH₄ + 2H₂O

Higher oxygen concentrations lead to greater water formation, which in turn affects the equilibrium conversion of CO₂ to CH. Table 2 shows that TPO experiments should be conducted with oxygen concentrations at or below 3% and at methanator temperatures below 430°C to avoid equilibrium limitations. However, the incomplete conversion of CO₂ to CH₄ observed in Table 1 is not attributable to equilibrium constraints.

An alternative explanation is that water inhibits the methanation activity of the ruthenium catalyst. To investigate this, experiments were conducted varying three parameters: the oxygen concentration in the carrier gas, the methanator temperature, and the carrier gas flow rate. As shown in Table 3, it was necessary to reduce the flow rate when higher oxygen concentrations were used

Additional experiments introduced water directly into the system by saturating the carrier gas at room temperature, producing a 2.6% water concentration in helium. This water level is comparable to that generated during oxidation in a 1.3% oxygen environment. These results confirmed previous findings that oxygen concentrations should ideally remain below 2%. For experiments requiring higher oxygen levels, an oxygen trap can be installed upstream of the methanator. These traps effectively remove oxygen without affecting the CO₂ concentration exiting the sample U-tube.

Temperature-Programmed Methanation Studies

Temperature-programmed methanation experiments were also performed to evaluate the stability of the ruthenium catalyst and to determine the optimal methanator temperature for converting CO₂ to CH.

As indicated in Table 3, CO₂ conversion increased with both rising temperature and decreasing flow rate. This behavior suggests that conversion limitations in the presence of oxygen are primarily kinetic in nature. Additionally, the catalyst’s activity improved with temperature. However, the methanator temperature should be kept as low as possible to minimize the risk of sintering the ruthenium particles, which would permanently reduce catalyst activity.

Effect of Carrier Gas Flow Rate and Catalyst Stability

Experimental results indicated that FID sensitivity increased linearly with carrier gas flow rates up to 60 cc/min. At higher flow rates, the FID response plateaued, suggesting that flow rates above this level do not further improve sensitivity.

An additional important observation was the deactivation of the ruthenium catalyst in the methanator due to sulfur poisoning. This deactivation was caused by sulfur oxides generated during the combustion of sulfur-containing coke deposits. The most effective solution was the installation of a sulfur oxide trap upstream of the methanator, which successfully removed sulfur contaminants without affecting the CO₂ concentration.

Conclusions

These experiments demonstrate that TPO coupled with methanation and FID detection is a highly effective technique for monitoring the carbon oxidation rate of coked catalysts. By optimizing experimental parameters, complete conversion of CO₂ or CO to CH is achievable, even in the presence of oxygen-containing carrier gases.

This method is sensitive enough to detect carbon concentrations below 0.1% and can distinguish subtle variations in the coke distribution on catalyst surfaces.

This Altamira Note summarizes a presentation delivered by Dr. S.C. Fung at an AMI (formally: Altamira's) U.S. User's Meeting. For further details on this TPO methodology, see: S.C. Fung and C.A. Querini, "A Highly Sensitive Detection Method for Temperature-Programmed Oxidation of Coke Deposits: Methanation of CO₂ in the Presence of O₂," Journal of Catalysis, 138, p. 240 (1992).

Note: AMI is the only company to integrate a chemisorption analyzer platform with an FID detection system and methanation reactor for advanced TPO studies. This unique configuration enables precise, real-time quantification of coke oxidation rates with unparalleled sensitivity.


Understanding Temperature-Programmed Reduction (TPR): Parameters and Profiles

Download PDF

Temperature-programmed reduction (TPR) is a powerful technique for obtaining direct information on the reducibility of catalysts and catalyst precursors. It is widely used to characterize a variety of catalyst materials. In a typical TPR experiment, the sample is exposed to a flowing mixture of a reducing agent—such as hydrogen diluted in an inert gas—while the temperature is increased linearly. The consumption rate of the reducing agent is continuously monitored and correlated to the reduction behavior of the sample.

Figure 1 presents a representative TPR profile for a 10% NiO/SiO₂ catalyst using a 10% H₂/Ar gas mixture at a flow rate of 30 mL/min and a linear heating rate of 20 K/min. The resulting profile provides insights into both the ease of reducibility (indicated by the temperature at the reduction peak maximum) and the extent of reducibility (reflected by the signal area).

A comprehensive description of TPR methodology can be found in Temperature-Programmed Reduction for Solid Materials Characterization by A. Jones and B.D. McNicol (Marcel Dekker, Inc., 1986).

However, comparing TPR results across different laboratories or literature reports can be challenging. No universally accepted experimental parameters exist for TPR experiments. Variables such as heating rate, reducing gas composition, flow rate, and particle size can all significantly influence the reduction profile.

This Altamira Note explores the impact of key experimental parameters on TPR results.

Monti and Baiker [1] developed an equation that relates the peak temperature (Tm) to the linear heating rate and hydrogen concentration for a first-order reduction process, as follows:

where:
Tm is the temperature at maximum signal;
[H₂] is the average hydrogen concentration;
rT is the linear heating rate;
Ea is the activation energy of reduction;
R is the gas constant; and
A is a pre-exponential factor.

This equation predicts a decrease in Tm with increasing hydrogen concentration and with decreasing heating rate. It also predicts that the observed temperature maximum is independent of flow rate—a prediction that is not supported by experimental observations.

The primary value of this equation lies in its ability to compare data obtained under different conditions. For example, Gentry and coworkers [2], in a study of CuO, determined Ea to be approximately 67 kJ/mol. Using a flow rate of 20 mL/min, a heating rate of 6.5 K/min, and an H₂ partial pressure of 0.1, they observed Tm = 280ºC. Applying their results to equation (1), it becomes possible to predict Tm for other experimental conditions. Figure 2 illustrates how the predicted Tm for CuO would vary with different hydrogen concentrations and linear heating rates according to equation (1).

The effects of flow rate are more complex and less easily predicted. Intuitively, one would expect Tm to decrease with increasing flow rate, and this trend is confirmed in the literature. Monti and Baiker [1] observed a decrease in Tm of 15°C for supported NiO when the total flow rate was increased from 30 mL/min to 60 mL/min. Similarly, in TPR studies of CuO using 5% H₂ and a heating rate of 20 K/min, increasing the flow rate from 30 mL/min to 80 mL/min resulted in a Tm decrease of 15°C. As a general guideline, a doubling of the flow rate typically results in a Tm decrease of approximately 10–20°C.

Because TPR is a bulk process, not all particles are exposed to the reducing gas simultaneously, making Tm dependent on particle size. However, predicting this dependence is complicated by the specific reduction mechanism involved. Lemaitre [3] examined this dependence across different reduction mechanisms, highlighting two that are especially relevant for catalysis:

  • Phase-boundary-controlled reduction, typical of bulk oxides, and
  • Nucleation-controlled reduction, typical of supported metals.

Interestingly, the predicted relationship between Tm and particle size varies with the reduction mechanism. For bulk oxides, Tm increases with particle size, whereas for supported metals, Tm decreases as particle size increases.

These various factors—and their combined effects on the TPR profile—are summarized in Figure 3. All should be carefully considered when comparing data from different laboratories or experimental setups.

References

  • A.M. Monti and A. Baiker, J. Catal.83, 323 (1983).
  • J. Gentry, N.S. Hurst, and A. Jones, J. Chem. Soc., Faraday Trans. I75, 1688 (1979).
  • L. Lemaitre, in Characterization of Heterogeneous Catalysts, F. Delannay (Ed.), Marcel Dekker, Inc.

Figure 1. Temperature-programmed reduction (TPR) profile of a 10% NiO/SiO₂ catalyst (10% H₂/Ar, 30 mL/min, heating rate 20 K/min).


Figure 2. Effect of hydrogen concentration and heating rate on predicted Tm for CuO

Figure 3. Relationship between experimental parameters and the observed Tm in TPR experiments.

Steady-State Isotopic Transient Kinetic Analysis (SSITKA) Technology in Catalytic Reactions

Download PDF

Background Introduction

Catalysts are at the heart of modern chemical manufacturing, with more than half of all chemical products depending on catalytic processes. Improving catalyst performance requires a deeper understanding of the physicochemical phenomena that occur at the catalyst–reactant interface, including diffusion, adsorption/desorption, surface reactions, and structural changes at the surface [1].  To investigate these processes, researchers study both the reaction mechanism and key kinetic parameters, such as surface coverage and reaction rates. One particularly powerful technique is SSITKA (Steady-State Isotopic Transient Kinetic Analysis), first introduced in the 1970s by Happel, Bennett, and Biloen.

SSITKA enables the measurement of kinetic parameters under true steady-state conditions. By rapidly switching from a reactant gas to its isotopically labeled analog—while maintaining constant flow, pressure, temperature, and catalyst surface state—SSITKA captures real-time information on surface intermediates, site coverages, and turnover rates without disrupting the reaction equilibrium. This application note reviews key literature examples of SSITKA in catalysis and highlights why AMI developed the AMI-200 then 300SSITKA—a fully integrated system designed to meet the growing demand for reliable, precise kinetic measurements.

Definition of SSITKA

SSITKA  is a technique that rapidly switches from a reactant gas to its isotopically labeled counterpart under steady-state conditions. Using mass spectrometry, the system monitors transient response curves as unlabeled reactants and products decrease and labeled species increase. This enables the quantitative study of heterogeneous catalytic mechanisms and surface kinetics. The “steady state” ensures constant flow rate, pressure, temperature, surface coverage, and reactant/product concentrations throughout the switch—minimizing interference from isotopic effects [2]. Since most industrial catalytic processes operate under steady-state conditions, SSITKA provides highly relevant insights into reaction pathways, site coverages, and apparent activation energies. While early versions relied on radioactive isotopes, modern SSITKA systems now use stable isotopes such as ¹³C, ¹⁸O, ¹⁵N, and D₂. The isotopic switch is typically achieved with a fast-acting four-way valve, alternating between labeled and unlabeled feeds. Analysis of the resulting transients reveals key kinetic parameters and mechanistic details.

Applications of SSITKA in Catalysis

SSITKA enables direct measurement of key kinetic parameters, including mean residence time, surface intermediate concentrations, and intrinsic rate constants. These values provide quantitative insight into active site density, reaction pathways, and the influence of supports, promoters, alloying, and deactivation mechanisms.

SSITKA in Catalytic Mechanism Studies

Ethylene, a key building block in organic synthesis, can be selectively oxidized to either acetaldehyde (using PdCl/CuCl catalysts) or ethylene oxide (EO) over silver-based catalysts. Despite decades of study, the identity of the active oxygen species (e.g., Agₓ–O vs. Ag–O–O–Ag) and the dominant reaction mechanism—whether Langmuir–Hinshelwood (L-H), Eley–Rideal (E-R), or Mars–van Krevelen (MvK)—remains under debate. To address this, Professor Israel E. Wachs and his team at Lehigh University combined in situ Raman spectroscopy with SSITKA to investigate ethylene oxidation over Ag/α-Al₂O₃ catalysts and clarify both the nature of the active sites and the operating mechanism [3].

Figure 1: SSITKA Experiment for C₂= + 16O₂ → 18O₂

Figure 1 shows mass spectra from SSITKA experiments using AMI-200. After switching from C₂= + 16O₂ → 18O₂ (Figure 1b, c), EO and CO₂ signals rapidly decay to zero within ~7 minutes, confirming ethylene epoxidation follows the L-H mechanism (requiring adsorbed ethylene and Ag₄-O₂ species). Post-switch, C₂H₄16O and C16O₂ signals gradually decrease, while C16O18O rises, indicating MvK (lattice oxygen) participation in CO₂ formation. SSITKA demonstrates that ethylene epoxidation predominantly follows L-H, while complete oxidation involves both L-H and MvK mechanisms.

SSITKA in Fischer-Tropsch (F-T) Synthesis

The conversion of synthesis gas (CO + H₂) into clean fuels and value-added chemicals is a key pathway for the efficient utilization of coal. However, the complexity of the product distribution and low selectivity of the reaction pose challenges to its industrial application. In recent years, cobalt-based catalysts have gained attention for producing high-quality diesel fuels, owing to their relatively slow deactivation and favorable carbon chain growth characteristics. While catalyst additives are known to significantly influence performance, their effects on reaction kinetics remain underexplored.  To address this, Professor Yang Jia’s team at the Norwegian University of Science and Technology, in collaboration with Professor Xiaoli Yang’s group at Qingdao University, modified Co-based catalysts with Rh, Ir, Sb, and Ga to evaluate their effects on Fischer–Tropsch synthesis [4]. SSITKA was used to investigate the catalysts’ intrinsic activity and surface adsorption behavior, providing deeper insight into the role of these additives in reaction kinetics.

Figure 2: (a) CO conversion rate and CH4 formation rate on CoM/Al2O3 catalyst under SSITKA condition. Normalized transient curves of (b) CoA, (c) CoRhA, (d) CoIrA, (e) CoSbA, and (f) CoGaA.

SSITKA experiments involved switching from 12CO/H₂/Ar to 13CO/H₂/Ar. Normalized transient curves (Figure 2) were analyzed to derive parameters in Table 1:

Table 1: SSITKA Parameters for Co-Based

Through steady-state SSITKA parameter analysis, it is found that: The amount of NCO surface intermediates of the reactants of CoRh/Al2O3 and CoIr/Al2O3 was (236 and 234 μmol gcat-1), respectively, which was 2 times higher than that of CoA (109.6 μmol gcat-1). The reduction of CoSb/Al2O3 and CoGa/Al2O3 catalysts is 53 and 39 μmol gcat-1, respectively. These data indicate that the precious metals Ir and Rh can promote the catalyst and increase more active sites, so that more CO can be adsorbed. The quantity of intermediates on the surface of the product NCHx has the same trend. However, non-precious metal Sb and Ga auxiliaries showed the opposite trend. At the same time, the residence time of the four auxiliaries was analyzed, and it was found that the residence time of the four auxiliaries had little difference, and the precious metal had no obvious effect on the intrinsic activity of the catalyst, while the non-precious metal reduced the active site and the intrinsic active site.

Figure 3: Relation between CO reaction rate of CoM/Al2O3 and concentration of CO and CHx intermediates

Figure 3 compares the CO reaction rate, surface intermediate concentrations, and intrinsic rate constants. The reaction rate of CO was found to be independent of NCO concentration, suggesting that CO conversion is not directly governed by NCO coverage, but rather by the surface coverage of CO and H₂. A linear relationship with NCHₓ concentration was observed, indicating that CHₓ intermediates play a key role in determining the reaction rate of CO.  Figure 4 illustrates the proposed carbon chain growth pathway. The addition of Ir and Rh was found to inhibit carbon chain growth, while Sb and Ga promoted it. These additives influence the surface concentration of CHₓ species during the reaction, which in turn affects both the CO reaction rate and the carbon chain growth rate constant, ultimately altering the product distribution.  Further analysis suggests that these effects stem from electronic modifications introduced by the additives. Changes in the electronic properties of the active metal lead to reduced adsorption strength, thereby shifting surface reactivity and selectivity.

Figure 4: Reaction Pathways for CHₓ Intermediate Conversion to CH₄ and C₂+

In summary, this paper by Yang J. et al. provides kinetic insight into how different additives influence the performance of Co-based catalysts in Fischer–Tropsch synthesis. Their work identifies the key kinetic factors underlying enhanced catalytic activity and offers a foundation for further catalyst optimization.

Steady-State Isotopic Transient Kinetic Analysis (SSITKA) is a powerful technique for quantifying surface intermediates and extracting kinetic parameters under true reaction conditions. With advancements in instrumentation and analytical methods, SSITKA is increasingly combined with complementary approaches such as in situ spectroscopy, kinetic modeling, and DFT calculations to provide a more comprehensive understanding of catalytic mechanisms. Recognizing the growing need for integrated, precise, and user-friendly tools, the AMI-300SSITKA system—a dedicated platform designed to perform reliable SSITKA experiments with high temporal resolution, stable gas switching, and seamless coupling to mass spectrometry. In future articles, we will explore the underlying principles of SSITKA and demonstrate how the AMI-300SSITKA supports advanced catalyst characterization and kinetic analysis.

References

[1] Recent Approaches in Mechanistic and Kinetic Studies of Catalytic, Cristian Ledesma, Jia Yang, De Chen, and Anders Holmen, ACS Catal. 2014, 4, 4527−4547

[2] Li, C. Y., & Shen, S. K. (1999). Steady-state isotopic transient kinetic analysis. Progress in Chemistry, 11(2), 49–59.

[3] Tiancheng Pu, Adhika Setiawan, Revealing the Nature of Active Oxygen Species and Reaction Mechanism of Ethylene Epoxidation by Supported Ag/-Al2O3 Catalysts: ACS Catal. 2024, 14, 406−417.

[4] Xiaoli Yang, Jia Yang, Anders Holmen, Kinetic insights into the effect of promoters on Co/Al2O3 for Fischer-Tropsch synthesis, Chemical Engineering Journal 445 (2022) 136655.

Application of Steady-State Isotopic Transient Kinetic Analysis (SSITKA) Technology in Catalytic Reactions

Download PDF

Building on our previous overview of SSITKA (Steady-State Isotopic Transient Kinetic Analysis), this article delves into the core principles and computational methods behind the technique. In addition, it explores how SSITKA can be integrated with in situ infrared spectroscopy to provide deeper insight into surface reactions and active site behavior.

1. Principle Explanation

1.1 SSITKA Experimental Device

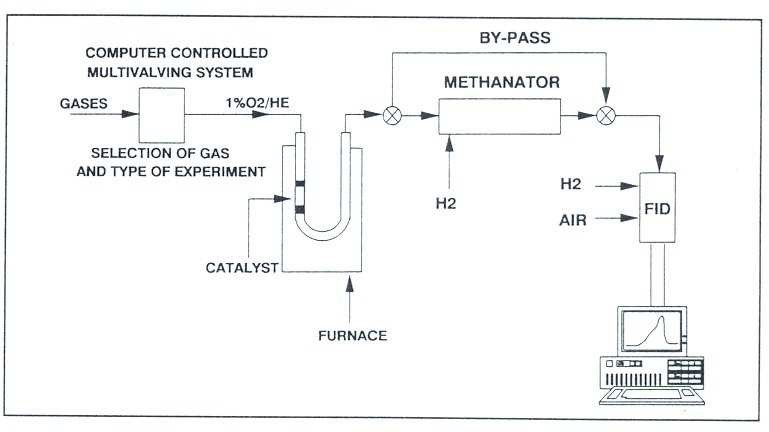
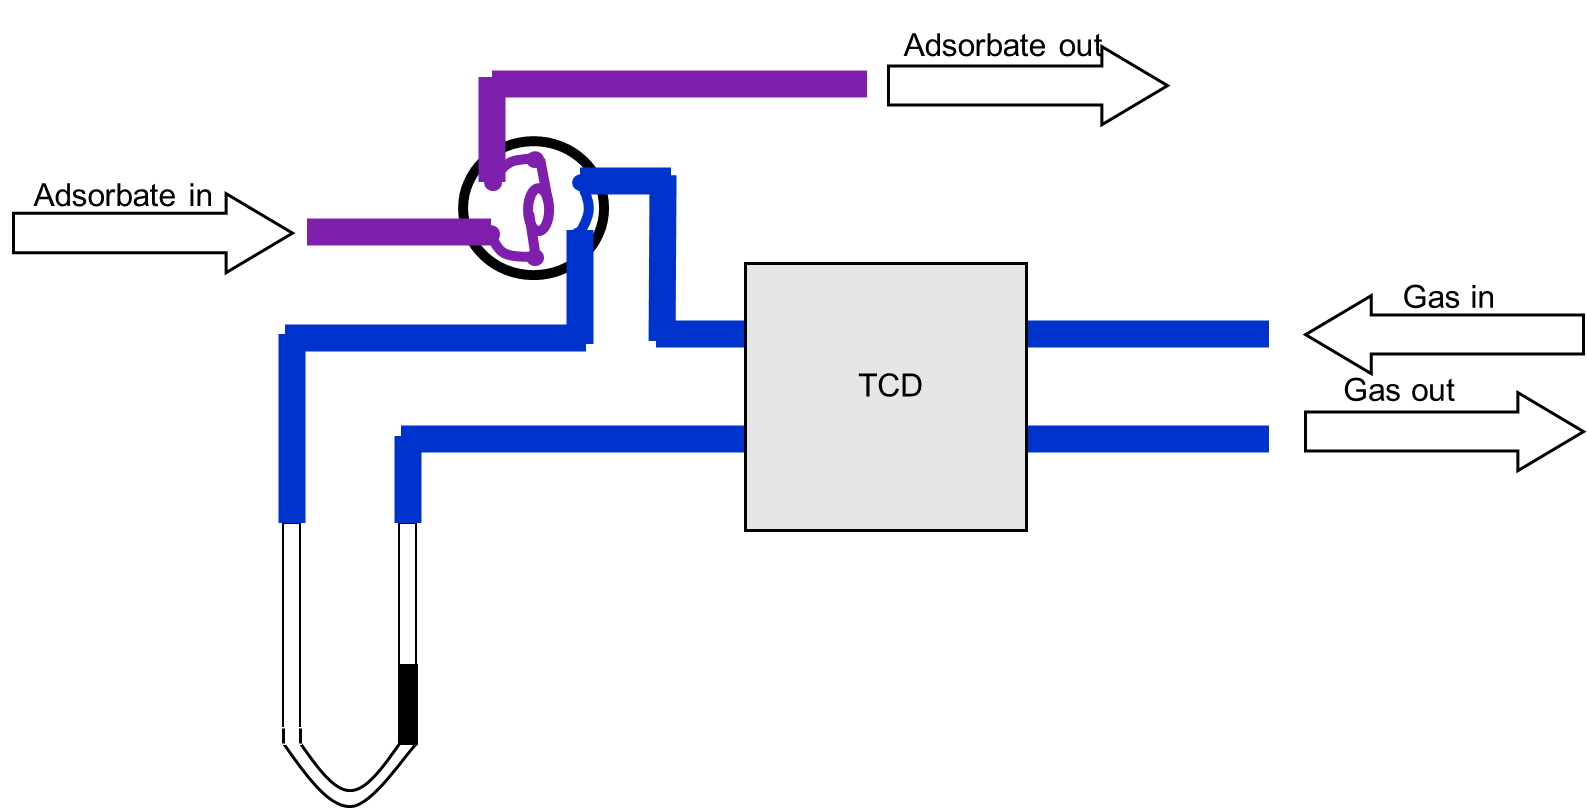
The schematic diagram of the SSITKA experimental setup is shown in Figure 1 [1]. It consists of three main components: a gas flow control system, a reactor, and a mass spectrometer. The gas flow system must support steady-state transient operation, enabling rapid and stable switching between isotopic feeds. It is also essential that both the pre- and post-switch conditions are well-defined and reproducible. The mass spectrometer must be capable of fast response to accurately capture transient signals.

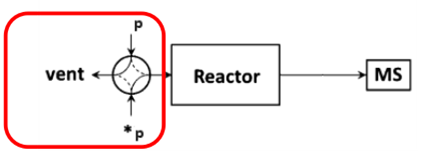
Figure 1 Schematic Diagram of SSITKA Experimental Device

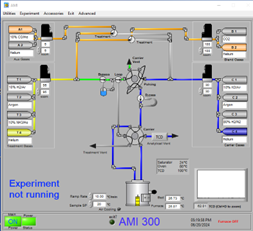
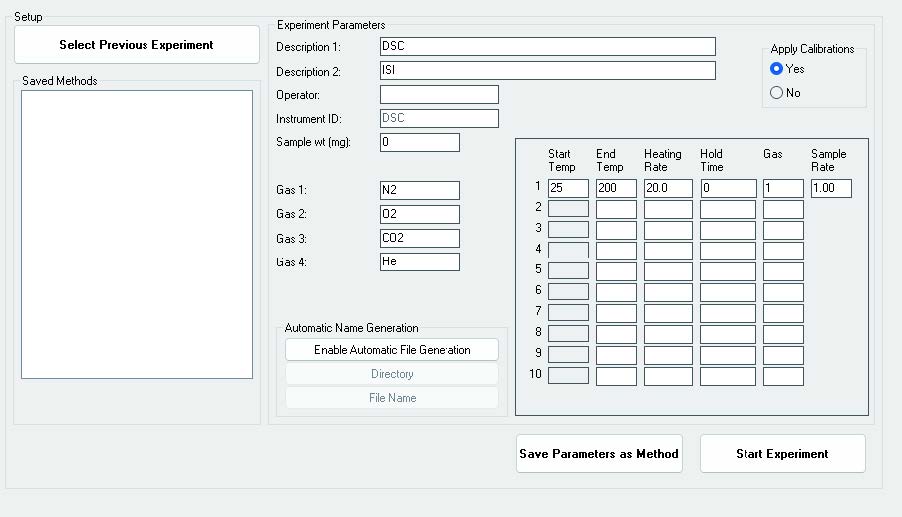
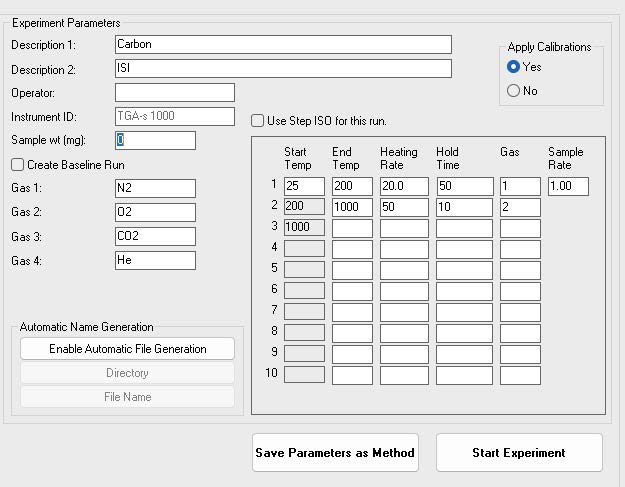
Most SSITKA experiments today rely on microreactor-based systems that are either manual or semi-automated, often leading to operator-induced variability. The AMI 300TKA system addresses this challenge by enabling fully integrated SSITKA experiments through dedicated gas circuit design and coupled mass spectrometry, as shown in the software interface in Figure 2. Transient switching is achieved using a four-way valve, which alternates between two feed streams: Aux Gases and Blend Gases. These streams introduce either the unlabeled reactant (12CO) or the isotopically labeled reactant (13CO). Upon valve switching, the system seamlessly transitions from 12CO to 13CO under steady-state conditions.

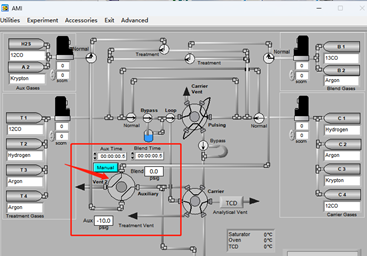
Figure 2 Software Interface of AMI 300TKA

SSITKA experiments can be executed automatically following the program shown in Figure 3. The fully automated process eliminates the need for manual intervention, significantly reducing the risk of human error and improving the accuracy and reproducibility of test results. The procedure is both practical and user-friendly, ensuring reliable operation even for complex transient kinetic studies.

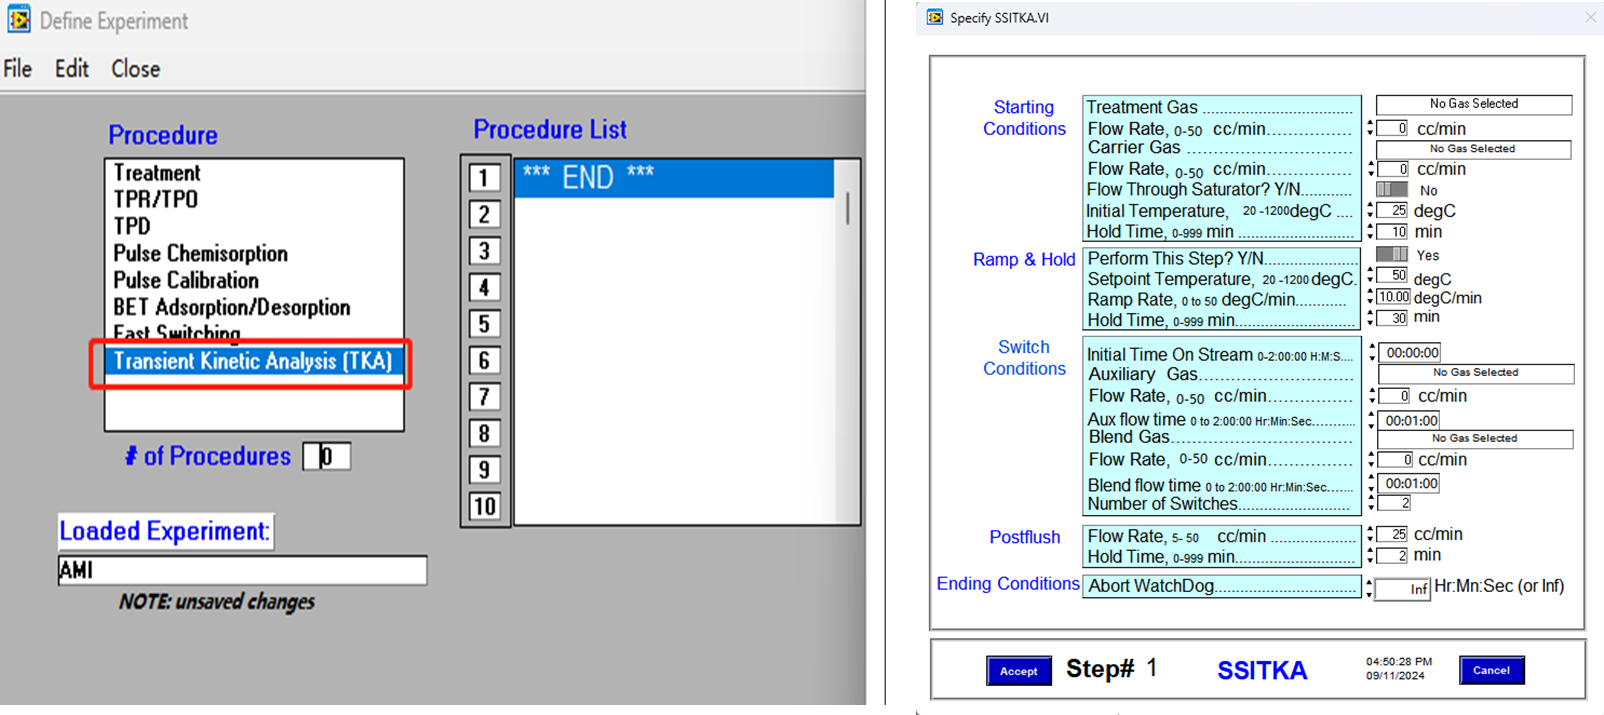
Figure 3 Kinetic Parameter Solving of SSITKA Program Setting of SSITKA on AMI 300TKA

1.2 Kinetic Parameters

1.2.1 General Parameters

  1. The surface residence time (τₚ) of surface intermediates and the surface coverage (Nₚ) are determined by monitoring signal intensity via mass spectrometry, as illustrated in Figure 4(a). Here, P represents the unlabeled product, P* is the isotopically labeled counterpart, and I denotes an inert tracer. At time t = 0, the four-way valve switches, introducing the labeled reactant. As a result, P and I display a decay in signal intensity, while P* shows a corresponding increase. By normalizing the decay profile of P, the transient response curve shown in Figure 4(b) is obtained.

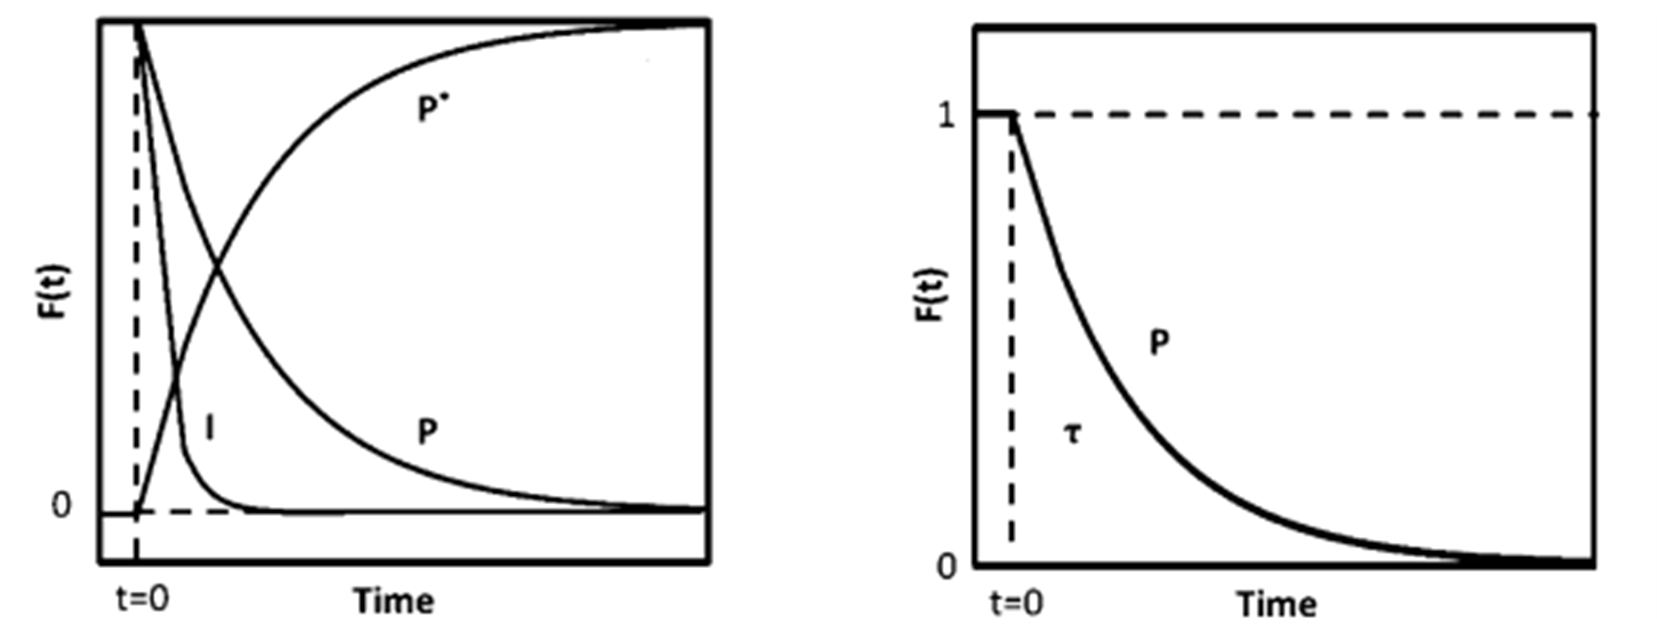
Figure 4 (a) Mass Spectrum (b) Transient Response Curve

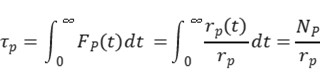
Without making kinetic assumptions or defining surface reaction mechanisms, two key parameters can be directly extracted from the transient response curve: the surface residence time (or surface lifetime) τₚ of the intermediate species that form product P, and the surface coverage Nₚ of those intermediates. The expression for calculating Nₚ is given below [2]:

During the experiment, the reactants were rapidly switched while maintaining a constant reaction rate. The reaction rate of the unlabeled product was determined using the following equation [3], where rₚ(t) represents the steady-state reaction rate of the unlabeled product, and rₚ(t) denotes the reaction rate of the isotopically labeled product.

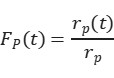
rₚ(t) is the steady-state reaction rate of the unlabeled product, and rₚ(t) is the reaction rate of the isotopically labeled product. As shown in Figure 4(b), normalizing the decay of the unlabeled product yields the transient response curve. The expression for Fₚ(t) is given as follows:

By rearranging and calculating the above three formulas, the surface residence time τP of the intermediate species can be obtained.

Integrating the transient response curve yields the surface residence time τP, as shown in Figure 5.

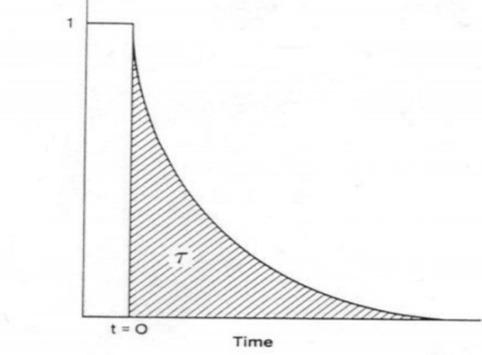
Figure 5 Surface Residence Time τP

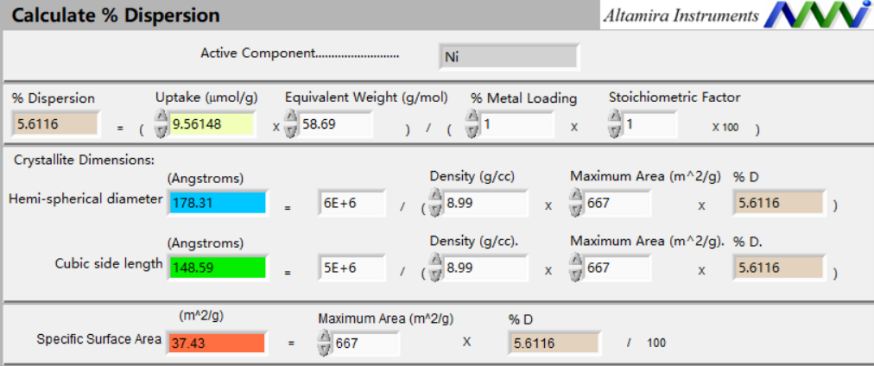
The surface coverage (θ) of intermediates, the reaction rate constant (k), and the turnover frequency (TOF) are calculated using chemisorption techniques to determine the total number of exposed metal atoms (Nₐ) on the catalyst surface.

Assuming that the chemical reaction on the surface is pseudo-first-order, the rate equation of the pseudo-first-order reaction can be expressed as:

Thus, the pseudo-first-order reaction rate constant is obtained:

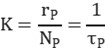
TOF (turnover frequency) represents the number of catalytic reactions occurring per unit time per active site. It reflects the catalyst’s instantaneous efficiency based on the number of surface active sites. The formula is as follows:

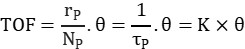
Here, θ represents the surface coverage of intermediate species. The number and distribution of active sites on the catalyst surface can be analyzed using deconvolution techniques, enabling further investigation into the kinetics and mechanism of the catalytic reaction.

1.2.2 Modeling of SSITKA

A heterogeneous catalytic reaction often proceeds through one or more surface-bound intermediate steps. The general parameters introduced earlier—τₚ (the total surface residence time of intermediate species) and Nₚ (the total quantity of surface intermediates leading to product P)—represent the overall behavior of all intermediates involved in forming product P. To distinguish the contribution of individual intermediates, Shannon [4] and Chen et al. [5], building on the work of Biloen et al. [6], proposed a surface reaction mechanism model, summarized in Table 1. This model categorizes reactions into reversible and irreversible types, and further into cases involving single, sequential (series), parallel, or more complex arrangements of intermediate species. Based on these classifications, transient response models were derived using material balance principles. These models allow for the extraction of dynamic parameters such as the quantity and residence time of each intermediate species involved in producing product P.

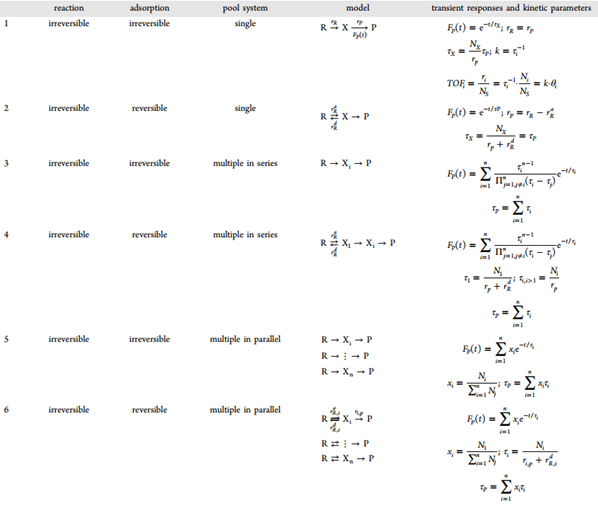
Table 1 [7]: Mechanism Model, Transient Response, and Kinetic Parameters Obtained from SSITKA

1.2.3 Inferring Catalyst Surface Reaction Mechanisms

Kobayashi et al. [8] demonstrated experimentally that the shape of the transient response curve can provide insights into the underlying reaction mechanism. Building on this, Shannon et al. presented representative response profiles for different irreversible reaction pathways—specifically, cases involving a single intermediate, two intermediates in series, and two intermediates in parallel—as illustrated in Figure 6.

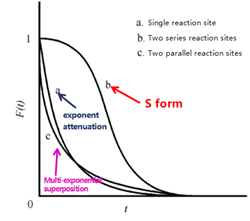
Figure 6 Schematic Diagram of Transient Responses for Different Surface Reaction Mechanisms

As shown in Figure 6, the transient response curves exhibit characteristic S-shaped profiles. Curve (b), which shows the slowest decay, corresponds to two sequential (serial) reaction intermediates—reflecting the extended time required for consecutive reactions at two sites. Curve (a), displaying a single exponential decay, represents a single intermediate species. Curve (c), with a multi-exponential decay pattern, corresponds to two parallel reaction intermediates, where the simultaneous operation of different reaction pathways leads to faster, overlapping decay components. By analyzing these distinct curve shapes, researchers can readily differentiate between kinetic models and infer the nature of surface reactions occurring on the catalyst.

1.3 Factors Influencing SSITKA Experiments

1.3.1 Chromatographic effects and re-adsorption:

In SSITKA experiments, both reactants and products can adsorb not only on the catalyst surface but also on the reactor walls and connecting pipelines, introducing a chromatographic effect. This effect can distort transient responses but may be minimized by reducing the distance from the four-way valve to the detector, increasing gas flow rates, and thermally insulating the transfer lines. The AMI-300TKA system addresses these challenges through the use of 1/16-inch tubing to reduce dead volume, thermal insulation of the valve box, and precise gas flow control via mass flow controllers—measures that collectively enhance measurement accuracy.

Additionally, product re-adsorption can significantly influence transient response data. When re-adsorption occurs at active sites, it reduces catalytic activity and lowers reaction rates. If it occurs at non-reactive sites, the activity remains unaffected, but the measured surface residence time of the product becomes artificially extended—combining the actual intermediate lifetime with the re-adsorption time. To correct for this, inert tracers and empirical correction formulas are commonly applied.

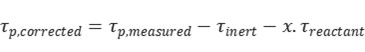
Where τinert is the surface residence time during inert gas response, x is empirically taken as 0.5.

1.3.2 Isotope Effect

SSITKA experiments are typically conducted under the assumption of steady-state conditions, with isotope effects considered negligible—that is, the kinetic behavior of isotopically labeled and unlabeled species is assumed to be identical. However, special attention is required when working with hydrogen and its isotopes (e.g., H/D), as the significant differences in mass and bond energy can lead to pronounced kinetic and thermodynamic effects. During H/D isotope exchange, changes in reaction rates and surface intermediates may disrupt steady-state conditions, potentially compromising experimental reliability. As a result, H isotope SSITKA experiments must be approached with caution. Despite these challenges, such experiments are valuable for probing surface reactivity, particularly in identifying bond cleavage events associated with adsorption, desorption, or reaction of specific molecular species.

2. The Use of SSITKA in Conjunction with Spectroscopy

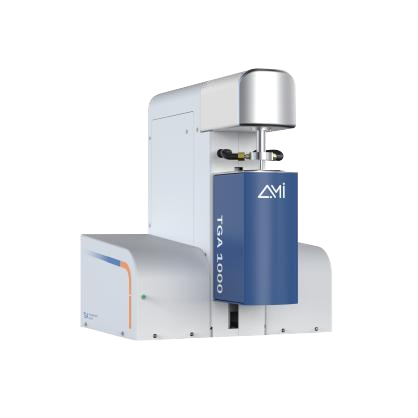
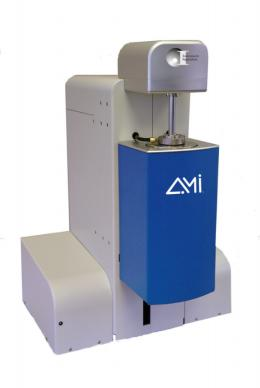
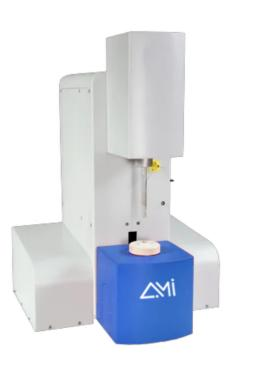
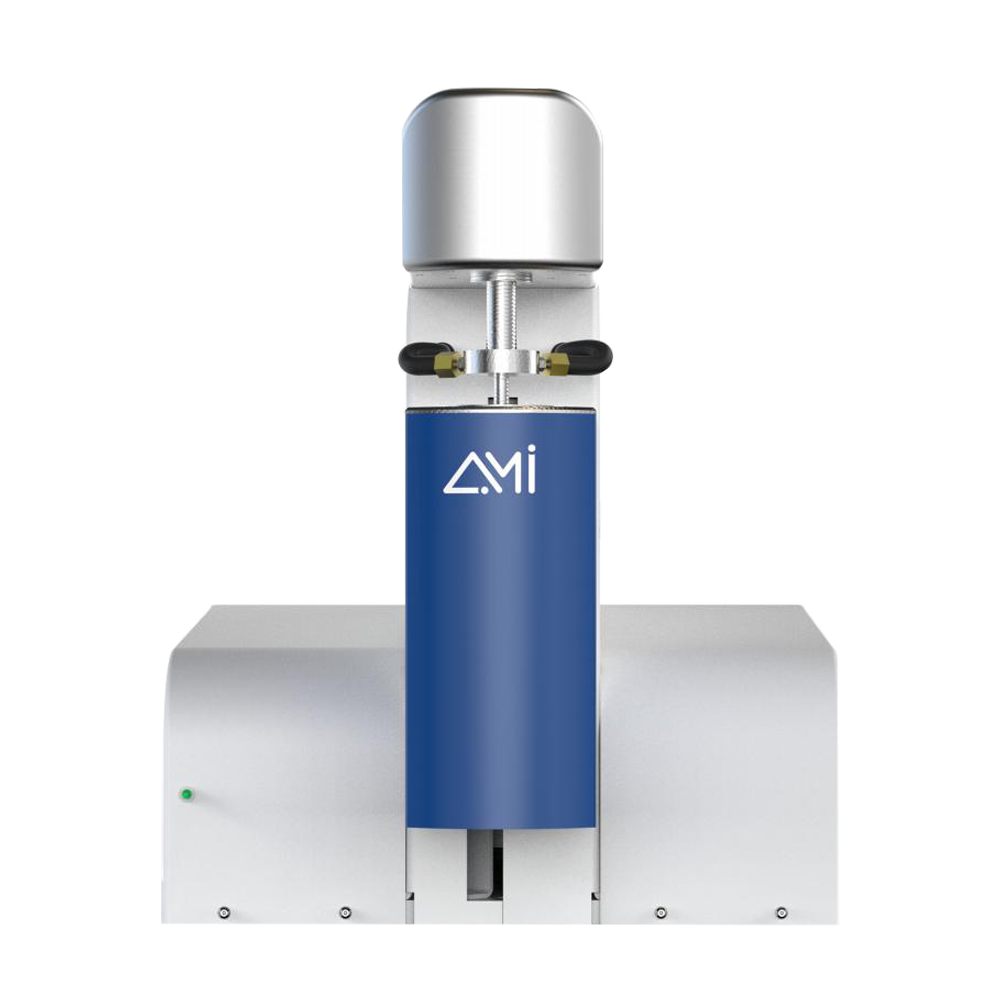
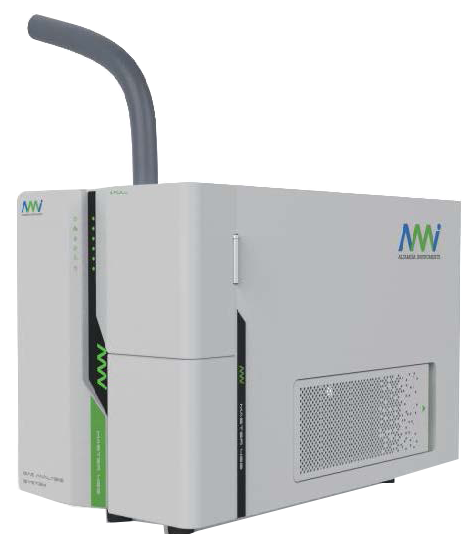
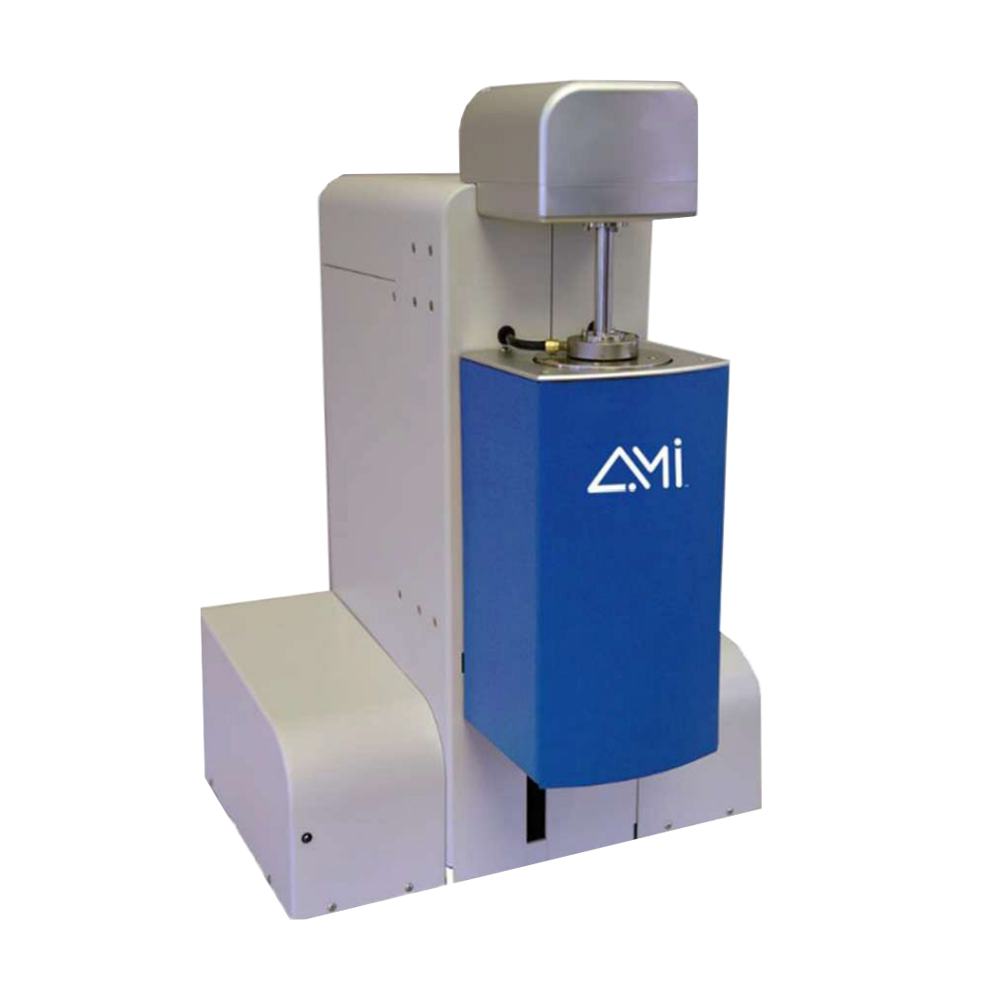
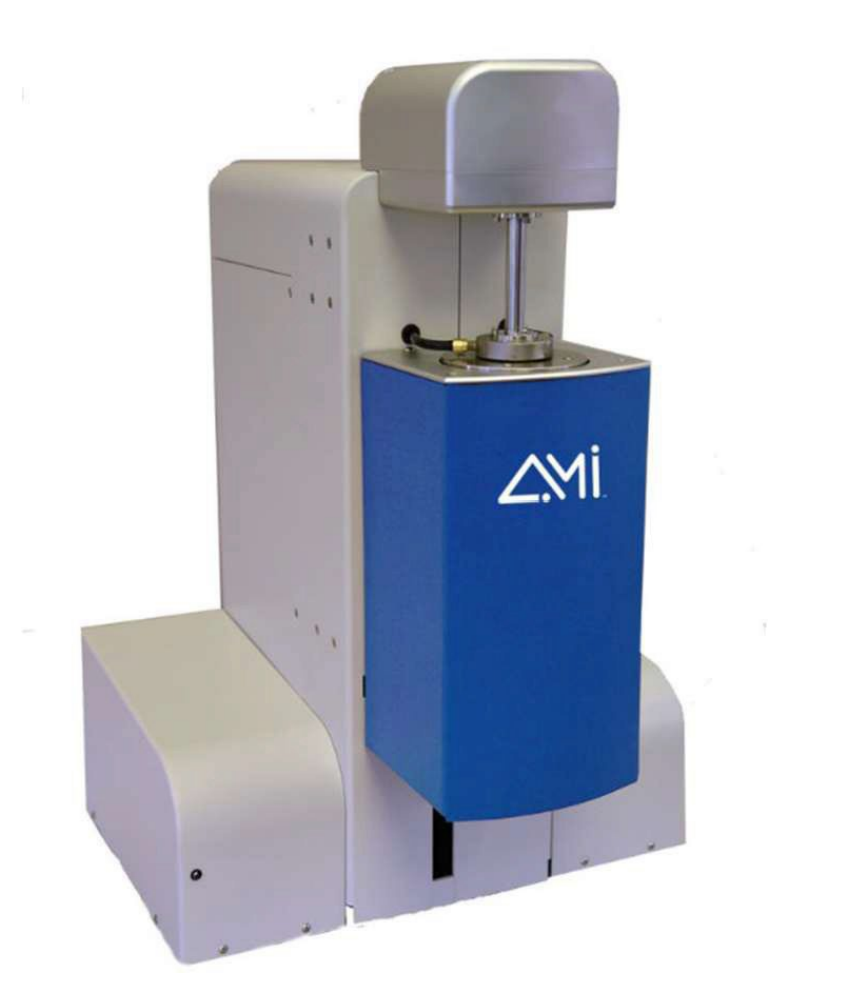
SSITKA is a powerful technique for determining the abundance and kinetic parameters of surface intermediates. However, its primary limitation is the inability to directly characterize the chemical structure of these intermediates or observe their surface reactions in real time. In contrast, in situ infrared (FTIR) spectroscopy enables direct observation of adsorbed species under reaction conditions [9]. By integrating SSITKA with FTIR, it becomes possible to accurately identify surface intermediates—including their chemical structure and surface coverage—and to distinguish reactive adsorbed species from non-reactive ones [10]. Figure 7 shows the AMI-300SSITKA system developed by AMI, which combines SSITKA with in situ infrared spectroscopy for advanced surface characterization.

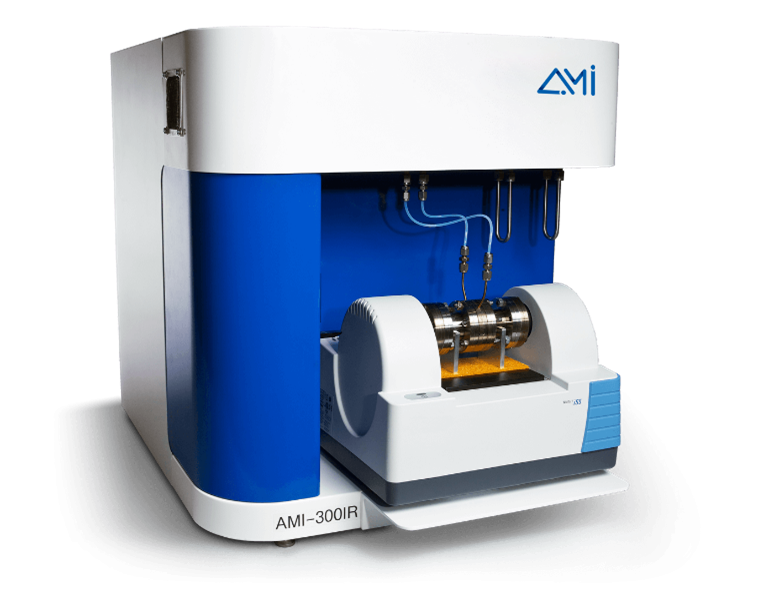
Figure 7 AMI-300TKA In-Situ Characterization

Since its development in the 1970s, SSITKA has been widely applied to investigate the mechanisms of numerous important industrial catalytic reactions. Today, the integration of SSITKA with spectroscopic techniques enables direct observation of surface intermediates and provides deeper insight into reaction mechanisms. Furthermore, combining SSITKA with complementary methods such as kinetic modeling and density functional theory (DFT) enhances our understanding of reaction pathways. The AMI-300SSITKA is the only commercially available SSITKA system that also serves as a fully featured chemisorption analyzer, offering unmatched versatility in a single platform. By leveraging the strengths of SSITKA alongside these advanced techniques, researchers can obtain a comprehensive picture of catalytic processes under true reaction conditions, facilitating the elucidation of complex chemical mechanisms.

References

[1] Li Chun-yi Shen Shi-hole transient mechanical analysis of steady-state isotopes [J] Advances in Chemistry, 1999,11(2):49-59.

[2] Recent Approaches in Mechanistic and Kinetic Studies of Catalytic, Cristian Ledesma, Jia Yang, De Chen, and Anders Holmen, ACS Catal. 2014, 4, 4527−4547.

[3] Anders Holmen, Jia Yang, and De Chen Springer Handbook of Advanced Catalyst Characterization, Springer Handbooks, Part VII Transient and Thermal Methods,2023,41,935 966.

[4] Shannon, S. L.; Goodwin, J. G. Chem. Rev. 1995, 95, 677−695.

[5] Berger, R. J.; Kapteijn, F.; Moulijn, J. A.; Marin, G. B.; De Wilde, J.; Olea, M.; Chen, D.; Holmen, A.; Lietti, L.; Tronconi, E.; Schuurman, Y. Appl. Catal., A 2008, 342, 3−28.

[6] Kondratenko, E. V. Catal. Today, 2010, 157, 16−23.

[7] Pansare, S.; Sirijaruphan, A.; Goodwin, J. G. In Isotopes in Heterogeneous Catalysis; Hutchings, G. J., Ed.; World Scientific Publishing Co.: London, 2006; Catalytic Science Series, Vol. 4, pp 183−206.

[8] Kobayashi H,Kobayashi M, Catal. Rev-Sci. Eng. 1974, 10, 139.

[9] Yokomizo G H, Bell A T, J. Catal., 1989, 119, 467—482.

[10] Efstathiou A M, Chafik T, Bianchi D et al. J. Catal., 1994, 148, 224—239.


Measuring Metal Dispersion by Pulse Chemisorption

Download PDF

1.   Introduction

Supported metal catalysts feature catalytically active metals dispersed across porous carriers such as alumina, activated carbon, or silica. These metals are typically present in a microcrystalline form, maximizing surface area and enhancing reactivity. However, in practice, only the surface-exposed metal atoms participate in catalytic reactions—atoms buried within the bulk structure remain inactive.


As a result, metal dispersion—the proportion of surface atoms relative to the total metal content—plays a pivotal role in catalytic performance. This is commonly quantified by IUPAC as:


Dispersion (%) = (Number of surface metal atoms / Total number of metal atoms) × 100


Highly dispersed catalysts offer enhanced activity, selectivity, and resistance to deactivation phenomena such as carbon deposition and sintering. Since many catalysts utilize precious metals, maximizing dispersion not only improves efficiency but also reduces material costs. Thus, accurately measuring dispersion is essential for both technical optimization and economic viability.


A variety of techniques are available to evaluate metal dispersion, broadly categorized into physical and chemical methods [1]. Physical techniques such as X-ray Diffraction (XRD), X-ray Photoelectron Spectroscopy (XPS), and Transmission Electron Microscopy (TEM) estimate dispersion indirectly by assessing crystallite size or surface composition. However, these approaches often require complex modeling and may struggle with heterogeneous or amorphous samples.


In contrast, chemical adsorption methods—such as pulse chemisorption and static chemisorption—offer a more direct measurement by quantifying the amount of probe gas that binds to active metal sites.


These techniques are especially valuable for characterizing the reactive surface area most relevant to catalytic behavior [2].


Chemisorption can also provide insights into crystallite size, active surface area, and the relative contributions of reversible and irreversible adsorption. Despite its power, the static method has some limitations: high-vacuum requirements, longer analysis times for multi-point isotherms, and potential errors from effects like hydrogen spillover [3] or strong metal–support interactions that block access to reactive sites [4].

Figure 1: Representation of metal sites on a support

2.   Methods

Dynamic chemisorption—commonly known as pulse chemisorption—is a widely used technique for measuring the surface-active metal sites in supported catalysts. In this method, reactive gas molecules selectively adsorb onto exposed metal atoms, without interacting with the carrier support.

The experiment is performed under isothermal conditions, typically at ambient temperature and atmospheric pressure. A calibrated sample loop injects fixed volumes of reactive gas into a flowing carrier gas stream. As the gas mixture passes over the catalyst bed, the reactive species adsorb onto available metal sites—often through associative adsorption—while unadsorbed gas continues downstream to a detector, such as a thermal conductivity detector (TCD).

Successive gas pulses are introduced until the catalyst surface becomes saturated and no further adsorption occurs. This saturation behavior, reflected in the detector signal, allows precise quantification of the adsorbed gas and thus enables accurate calculation of metal dispersion and active surface area.

Figure 2: Pulse Chemisorption Instrumentation

Figure 3: “Missing Peaks” representation of the TCD signal

3.   Calculations

In pulse chemisorption, the adsorption quantity is the key parameter for quantitative analysis. It represents the amount of reactive gas adsorbed per unit mass of catalyst, typically expressed in µmol/g. This value is conceptually aligned with physical adsorption but derived through chemical interaction between the adsorbate and active metal sites.


During the experiment, a fixed volume of reactive gas is repeatedly pulsed into a flowing carrier gas stream through a calibrated sample loop. As the gas passes over the catalyst bed, it interacts with exposed metal sites, while unadsorbed gas is carried to a thermal conductivity detector (TCD), generating a series of pulse peaks (Figure 3).


As the surface nears saturation, gas uptake decreases and the detector signal stabilizes. The final peak, corresponding to complete saturation, serves as the baseline for calculating gas uptake in earlier pulses.

Quantification of adsorption is based on comparing the area of each unsaturated pulse to the average area of saturated peaks. Two primary calculations are used:


Quantitative Correction Value (Cv):

Cv = (V_loop × C_gas) / (ΣA_sat / n_sat)

Where:

  • V_loop = Volume of the sample loop
  • C_gas = Concentration of the adsorptive gas
  • ΣA_sat = Sum of saturation peak areas
  • n_sat = Number of peaks used for saturation averaging


Sample Adsorption Amount (Uptake):

Uptake = Cv × Σ(A_i - A_sat-avg)


Where:

  • A_i = Area of each unsaturated pulse
  • A_sat-avg = Average saturation peak area (= ΣA_sat / n_sat)


The calculated adsorption quantity forms the basis for further analysis of catalyst structure, including:

  • Metal dispersion (%)
  • Crystallite size (nm)


Required known values:

  • Metal loading (wt%)
  • Relative atomic mass (g/mol)
  • Stoichiometric factor (reaction-specific)


The stoichiometric factor reflects the number of metal atoms associated with each adsorbed gas molecule and depends on the adsorption mechanism:


  • H₂ adsorption (dissociative): SF = 2
  • CO adsorption:

- Linear: SF = 1

- Bridging: SF = 0.5

- Multi-type (on oxides): SF = 1–n


Metal dispersion indicates the percentage of metal atoms located on the surface:


Dispersion (%) = [Adsorption (µmol/g) × Relative atomic mass (g/mol)] / [Metal loading (%) × Stoichiometric factor × 100]


Where:

  • Adsorption (µmol/g): Calculated from pulse chemisorption
  • Relative atomic mass: e.g., Pt = 195.08
  • Metal loading (%): From catalyst specification
  • SF: From adsorption mechanism


Crystallite size can be estimated using geometric models. Two common models are:


Hemispherical Model:


Particle diameter (Å) = 6 × 10⁶ / [Density (g/cm³) × Max SSA (m²/g) × Dispersion (%)]

Cubic Model:

Cube edge length (Å) = 5 × 10⁶ / [Density (g/cm³) × Max SSA (m²/g) × Dispersion (%)]


Where:

  • Density (g/cm³): e.g., Pt = 21.45
  • Max specific surface area (SSA): From chemisorption data
  • Dispersion (%): From formula above
  • 1 Å = 0.1 nm


Note: These formulas are valid for single-metal catalysts. For bimetallic or alloy systems, peak separation via Temperature-Programmed Desorption (TPD) is recommended for accurate analysis.

Figure 4: Software Calculation Interface

4.   Experiment

The metal dispersion degree of a 1 wt% Pt/CeO₂ catalyst was measured using the AMI-300 chemisorption analyzer, known for its high performance and precision in pulse chemisorption experiments.


  • Sample mass:0816 g
  • Instrument used: AMI-300
  • Adsorptive gas: H₂
  • Method: Pulse chemisorption
  • Detection: Thermal Conductivity Detector (TCD)


The sample underwent a pre-treatment process prior to measurement. The conditions are outlined below:

The pulse chemisorption experiment was conducted under the following operating parameters:


  • Gas flow rate: 30 cm³/min
  • Pulse volume (quantitative loop): 57 μL
  • Test temperature: 50 °C


Following the pre-treatment, a series of gas pulses were introduced to the catalyst sample. The resulting TCD response curve reflects the consumption of hydrogen gas over successive pulses until adsorption saturation was reached.

Figure 6: TCD for Pulse Chemisorption

Based on the TCD signal and experimental conditions, the hydrogen pulse chemisorption analysis of the 1 wt% Pt/CeO₂ sample yielded the following results:


  • Adsorption capacity: 4.742 µmol/g
  • Metal dispersion degree: 18.5%
  • Metal surface area: 43.477 m²/g
  • Estimated crystallite size:
  • Spherical model diameter:4338 nm
  • Cubic model edge length:3615 nm


These results indicate a moderately dispersed Pt phase on the CeO₂ support, with nanoscale crystallites and a high accessible metal surface area of 43.5 m²/g. A dispersion value of 18.5% is typical for platinum catalysts prepared by conventional impregnation methods and subjected to high-temperature calcination, where dispersion often ranges between 10% and 30%. These characteristics suggest the catalyst is well-suited for applications requiring accessible Pt active sites, such as hydrogenation or oxidation reactions.


1.   Discussion


Accurate quantification of metal dispersion by pulse chemisorption depends on several experimental variables. The following factors can significantly impact data quality and should be carefully considered to ensure reproducible and reliable results.

  1. Selection of Adsorption Gas and Measurement Method

Some noble metal-supported catalysts (e.g., Pt, Pd, Rh) exhibit the hydrogen spillover effect when using H₂ as the adsorptive gas. This can lead to overestimated dispersion values, occasionally exceeding 100%.


Cause:

Hydrogen dissociates on the metal surface, forming atomic hydrogen that migrates onto the support material (typically a metal oxide). The detector then incorrectly attributes this additional uptake to the metal.


Recommended Solutions:

  • Use CO as the probe gas to avoid spillover.
  • If H₂ is required, cross-check results with complementary methods such as TPD or TEM.


  1. Quantitative Loop Size and Gas Volume

If the first pulse peak is similar in area to later pulses, the sample may be saturated on the first injection—leading to poor resolution of adsorption behavior.


Cause:

The sample loop volume is too large relative to the adsorption capacity of the catalyst.


Recommended Solution:

  • Use a smaller-volume loop to better capture the progressive uptake profile.
  • The AMI-300 chemisorption analyzer offers interchangeable quantitative rings to match loop volume to sample capacity.


  1. Gas Concentration Optimization

A flat adsorption curve may indicate that the gas concentration is too high, resulting in saturation within a single pulse.


Cause:

High adsorbate concentration delivers more reactive gas than the catalyst can gradually adsorb.


Recommended Solution:

  • Lower the concentration of the adsorptive gas to allow a more gradual uptake.
  • The AMI-300 system features four wide-range, high-precision MFCs (5–100 mL/min) that enable accurate gas mixing—even down to 0.0025% concentration for trace-level analysis.


  1. Incomplete Saturation After Multiple Pulses

In some cases, saturation may not be reached even after many gas pulses.


Cause:

The adsorbate volume per pulse is insufficient for the catalyst’s capacity.


Recommended Solutions:

  • Increase the pulse volume by selecting a larger loop.
  • Raise the adsorbate concentration to improve the delivered dose per injection.
  • The AMI-300’s flexible gas mixing and modular loop system support easy adjustments.


  1. Temperature Effects on Adsorption Accuracy

Temperature has a major influence on adsorption behavior and data accuracy.


Potential Issues at Elevated Temperatures:

  • Hydrogen spillover
  • Unwanted side reactions between gas and support
  • Thermal decomposition or dissociation of the adsorbate


Recommended Practices:

  • Perform tests at or near room temperature, which is standard for most metal–gas systems.
  • For some sensitive measurements, low-temperature adsorption improves accuracy and minimizes spillover.


Example Conditions:

  • For Pt with H₂ or CO: Test at room temperature or 195 K
  • The AMI-300’s integrated cooling module enables testing as low as 143 K (–130 °C) for enhanced control and resolution.

Figure 7. Pulse loops available for the AMI-300 chemisorption system.

6.   Conclusions


The AMI-300 chemisorption analyzer provides precise, reliable measurement of surface metal dispersion and crystallite size in supported metal catalysts. By enabling control over key parameters—such as gas type, concentration, pulse volume, and temperature—the system supports detailed investigations into:

  • Surface chemistry and metal–support interactions
  • Catalyst activity and efficiency
  • Reaction mechanisms and intermediates
  • Deactivation behavior and regeneration strategies


With its simple operation and high repeatability, pulse chemisorption using the AMI-300 is an indispensable tool for researchers and engineers across a wide range of catalytic and materials science applications.


2.   References

[1] Whyte T E.Catal Rev, 1973, 8:  117-145

[2] Yang Chunyan, Yang Weiyi, Ling Fengxiang, Fan Feng. Determination of Surface Metal Dispersion of Supported Metal Catalysts [J]. Chemical Industry and Engineering Progress, 2010, 29(8): 1468-1501.

[3] Liu Weiqiao, et al. Practical Research Methods for Solid Catalysts [M]. Beijing: China Petrochemical Press, 2000: 38-39, 44, 230-232.

[4] Chen Songying, et al. Adsorption and Catalysis [M]. Zhengzhou: Henan Science and Technology Press, 2001: 124-125

Catalyst Performance Characterization Solution

Download PDF

Research Background

Heterogeneous catalytic processes are extremely complex surface physicochemical processes. The main participants in these processes are catalysts and reactant molecules, primarily involving the cyclic repetition of elementary steps, including diffusion, chemical adsorption, surface reaction, desorption, and reverse diffusion. The most critical steps are adsorption and surface reaction.

Therefore, to elucidate the intrinsic role of a catalyst in a catalytic process and the interaction mechanism between reactant molecules and the catalyst, it is necessary to investigate the catalyst's intrinsic structure (e.g., specific surface area and pore structure), adsorption properties (e.g., structure of adsorption centers, energy state distribution, adsorption states of molecules on adsorption centers), and catalytic properties (e.g., nature of active catalytic sites, metal dispersion). Further studies should also include mass transfer processes, reaction mechanisms, long-term stability, and pilot-scale evaluation to comprehensively assess catalyst effectiveness.


Solutions


2.1 Pore Structure

Heterogeneous catalytic reactions occur on the surface of solid catalysts. To maximize reaction activity per unit volume or weight, most catalysts are designed with porous structures to increase surface area. The porous structure and pore size distribution directly influence diffusion and mass transfer, which in turn affect catalytic activity and selectivity.


Zeolite catalysts are a class of microporous crystalline materials with uniform pore structures and extremely high surface areas. Figure 1 demonstrates nitrogen adsorption-desorption curves. In the low-pressure region, nitrogen adsorption sharply increases due to micropore filling. The HK pore size distribution reveals the most probable diameter is 0.57 nm, and the BET surface area is calculated as 675 m²/g.

FIGURE 1: Zeolite N₂ Adsorption-Desorption Isotherms (A) Linear Scale, (B) Logarithmic Scale, (C) HK Micropore Size Distribution

ctivated alumina is another widely used catalyst support. It shows excellent surface acidity and thermal stability. Figure 2 shows adsorption curves of two alumina samples with surface areas of 192.32 m²/g and 210.81 m²/g. BJH analysis indicates pore size peaks at 3 nm and 21 nm.

Nickel-loaded cerium dioxide (CeO₂) catalysts are notable for their redox cycling and oxygen storage. Figure 3 shows how increasing Ni loading reduces surface area (from 15.25 to 7.59 m²/g) and pore volume, due to Ni occupying surface sites.

FIGURE 3: (a) Ni@CeO N Adsorption-Desorption Isotherms, (b) BJH Pore Size Distribution


2.2 Active Centers

The intrinsic active sites of catalysts are key to their reactivity. These are best characterized dynamically under operating conditions. AMI systems apply temperature-programmed techniques (TPx series) for this purpose.


Temperature-Programmed Reduction (TPR)


TPR measures reducibility and interactions of active metal oxides with supports. Figure 4(a) shows a metal-supported alumina catalyst with a single strong reduction peak at 234°C and hydrogen consumption of 9680 µmol/g. Figure 4(b) shows three distinct peaks for Mn₂O₃ → Mn₃O₄ → MnO → Mn transformations. Figure 4(c) compares different Ni loadings on CeO₂, showing increasing reduction temperatures and decreasing hydrogen consumption as Ni loading increases.

FIGURE 4: H₂-TPR (a) Alumina-supported Catalyst, (b) Mn₂O₃-based Catalyst, (c) Ni@CeO₂ Catalyst Temperature-Programmed Oxidation (TPO)

TPO is used to evaluate coke deposition and regeneration conditions. Figure 5 shows TPO data for a Cr₂O₃ catalyst after reaction, with three peaks at 500°C, 578°C, and 631°C. The high-temperature coke species dominate, indicating a need for high-temperature regeneration.

Conclusion

Comprehensive catalyst characterization requires more than surface-level insight. From understanding pore architecture to quantifying redox behavior and coke formation, each technique provides a piece of the puzzle.


The integration of N₂ physisorption, TPR/TPO/TPSR, and pulsed chemisorption is essential for evaluating both performance and durability under realistic reaction conditions.


AMI’s chemisorption and physisorption instrument platforms enable researchers to conduct these analyses with precision and flexibility, combining automated gas handling, programmable thermal profiles, and real-time detection in a unified workflow.


Whether developing next-generation catalysts or optimizing industrial formulations, AMI provides the tools needed to accelerate R&D and ensure reliable, reproducible results.


With proven solutions for academia, government labs, and industry, AMI continues to support catalyst development from lab-scale discovery to pilot-scale deployment.

DSC 600

INTRODUCTION

  • The DSC 600 from Advanced Measurement Instruments (AMI) is the next generation of Differential Scanning Calorimeters (DSC), crafted to meet the evolving needs of professionals in materials research, chemical engineering, quality control, petrochemicals, and pharmaceuticals. Designed for precision, reliability, and affordability, the DSC 600 sets new standards in thermal analysis.
  • At the heart of the DSC 600 is its innovative heat flux plate, engineered to capture the smallest energy changes with unmatched sensitivity and accuracy. This powerful capability enables precise measurements across a broad spectrum of applications, including enthalpy, glass transition, heat of crystallization, purity determination, and heat capacity.
  • Equipped with an ultra-light furnace, the DSC 600 ensures excellent thermal conductivity and stability, delivering consistent performance across a wide temperature range. With a selection of specialized heat flux plates, it can be tailored to meet diverse testing needs,enhancing efficiency and flexibility in every lab.
  • Typical Applications
  • Melting Temperature
  • Crystallization Temperature
  • Heat of Chemical Reaction
  • Glass Transition Temperature
  • Specific Heat Capacity
  • Degree of Crystallinity
  • Degree of Cure
  • Oxidative Stability
  • Thermal Stability
  • Solid-State Phase Transition
  • Liquid Crystal Phase Transition
  • Aging of Materials
  • Polymorph
  • DSC 600

FEATURES

  • Precision
  • High-sensitivity heat flow sensor platform delivers calorimetric accuracy of ±0.1%. With four distinct heat flow sensor types available, it comprehensively meets the precise measurement needs of diverse materials, accommodating a wide range of experimental and application scenarios.
  • Featuring innovative furnace technology and unique sensor design, the system achieves exceptional baseline repeatability while offering low noise, high sensitivity, and outstanding resolution. This ensures the detection of even minute thermal changes that might otherwise be lost in noise.
  • Stability
  • The mineral-insulated furnace body design combines excellent thermal conductivity with corrosion resistance, while dual-PID temperature control ensures data accuracy and stability.
  • Advanced circumferential heating technology and a proprietary dual-PID control system guarantee precise adherence to programmed temperature profiles during both heating and cooling phases. With temperature control accuracy of ±0.01°C, the system significantly minimizes thermal fluctuations that could compromise experimental results.
  • Ease of Use
  • The intuitive software interface features streamlined UI and modular architecture, enabling effortless operation. Researchers can quickly master experimental setup, data analysis, and all critical workflows.
  • The maintenance optimized furnace design allows easy cleaning even after sample contamination during loading, significantly enhancing experimental efficiency while extending equipment service life.
  • High-Precision Heat Flow Sensor
  • The self-developed high-sensitivity heat flow sensor platform delivers low noise, high sensitivity, and exceptional resolution to reliably detect minute thermal variations that might otherwise be obscured by noise.
  • Four Types of Heat Flow Sensors
  • The DSC600 offers four types of heat flow sensor platforms: standard testing type, high-sensitivity type (for biopharmaceutical materials), corrosion-resistant type (for corrosive samples), and energetic materials type (for chemical reactions). These sensors meet the requirements of different application scenarios and sample types.
  • Precision Temperature Control
  • The system utilizes circumferential heating technology and a proprietary dual-PID control system to ensure exact adherence to programmed temperature curves during heating/cooling processes. With a temperature control accuracy of ±0.01°C, it effectively minimizes thermal fluctuations that could compromise experimental results.
  • Ultralight Mineral Furnace
  • The silver-constructed furnace body delivers exceptional thermal conductivity and stability, ensuring precise temperature control and rapid thermal response. The pure silver material effectively minimizes heat loss while enhancing analytical efficiency, achieving uniform heating/cooling across samples. Its superior corrosion resistance extends instrument service life, accommodating diverse experimental environments.
  • Automatic Gas Switching Control
  • The multi-channel gas inlet device enables automatic gas switching during experiments. This integrated unit combines four or six gas lines into a single module to meet the demands of frequent gas changes across different testing procedures.
  • Gas Preheating Function
  • The furnace incorporates heated gas lines at the inlet ports, enabling gas preheating before entering the sample chamber. This design stabilizes experimental conditions and enhances testing efficiency.
  • Three High-Efficiency Cooling Systems
  • The DSC 600 is equipped with three high-efficiency cooling systems, offering versatile refrigeration options: water bath cooling, mechanical refrigeration, and liquid nitrogen cooling.
  • The water bath cooling system regulates furnace temperatures from 10°C to 600°C, ideal for scenarios not requiring cryogenic conditions, such as polymer melting point and crystallization temperature analysis. The mechanical refrigeration system covers a temperature range of -90°C to 450°C, widely used in polymer material analysis, including glass transition studies, crystallization kinetics research, and conventional low-temperature testing applications.
  • The liquid nitrogen cooling system utilizes the endothermic properties of evaporating liquid nitrogen for rapid cooling, with a furnace temperature range of -150°C to 600°C. It is primarily employed for ultra-low temperature research, such as metal alloy phase transitions, superconducting material analysis, and rapid quenching experiments, including amorphous material preparation and fast cooling process studies.

SOFTWARE

  • Experiment Program Setup Interface
  • Standard Functions
  • · Glass transition analysis
    (2-point or 6-point method)
  • · Onset/peak temperature determination
  • · Peak integration
  • · Melting peak analysis
  • · Crystallinity measurement
  • · Data smoothing
  • · Baseline correction
  • Optional Functions
  • Specific Heat Capacity:
    The system rapidly determines specific heat values by testing samples alongside reference materials with known heat capacity (e.g., sapphire) under identical conditions.

SPECIFICATIONS

Temperature Range -150~600°C
Temperature Accuracy ±0.1°C
Temperature Precision ±0.01°C
Program Rate 0.1~200°C/min
Cooling Mode Water Cooling Refrigerated Cooling Liquid Nitrogen Cooling
Maximum Temperature 600°C 450°C 600°C
Minimum Temperature Ambient Temperature -40°C or -90°C -150°C
Calorimetric Accuracy ±0.1%
Noise 0.5 μw
Gas Nitrogen, Argon, Helium, Compressed air, Oxygen, etc.
Sampling Frequency 10 Hz
Weight 27 lbs.
Dimensions 17 in(W) × 17 in(D) × 9.5 in(H)
  Options
Gas Controller 4 Channel Automatic Gas Switching
Software Functions Specific Heat Capacity

MATERIALS

  • Thermoplastics
  • Thermosets
  • Rubbers
  • Catalysts
  • Phenolics
  • Pharmaceuticals
  • Chemicals
  • Coals and other fuels
  • Nuclear Research
  • Foods
  • Cosmetics
  • Explosives

APPLICATIONS

  • Cold Crystallization Behavior of PET
  • The crystal growth and degree of crystallization depend on the polymer type, cooling rate, or isothermal aging time. The calculation method for crystallization enthalpy is the same as that for melting enthalpy. Cold crystallization is the process of crystal growth during heating. This exothermic event precedes crystal melting.
  • Glass Transition Analysis
  • The glass transition temperature (Tg) of polymers refers to the temperature range at which they transition from a rigid "glassy" state to a flexible "rubbery" state, significantly affecting their usability, particularly in elastomers. Understanding Tg is crucial for quality control, process optimization, ensuring product performance, and maintaining material consistency.
  • Phase Transformation of Nickel-Titanium Alloys
  • The Af temperature refers to the phase transition temperature of nickel-titanium alloys, marking the transformation from the high-temperature phase (a-phase) to the low-temperature phase (f-phase). In the high-temperature phase, the crystal structure of nickel-titanium alloy exhibits a cubic system, while in the lowtemperature phase it transforms into a monoclinic system. This phase transition temperature change gives nickel-titanium alloys their shape memory properties. These shape memory characteristics enable important applications across various fields, such as medical devices, aerospace, and mechanical engineering.

ACCESSORIES

  • Crucibles
  • Crucibles serve as sample containers in thermal analysis measurements, effectively protecting sensors and preventing measurement contamination. The selection of crucible type is critical for result quality. We offer various crucible options to meet different testing requirements, ensuring accurate and reliable measurement results.
  • Pellet Press
  • The crucible pellet press elevates sample encapsulation to higher performance and convenience, suitable for routine and hermetic testing of various materials. The standard model is specifically designed for solid sample crucibles, while the universal model handles both solid and liquid sample crucibles, offering greater flexibility for your experiments.
  • Fully Automated Chiller
  • The fully automated recirculating bath enables precise continuous temperature control within the range of -10°C to 90°C. When coupled with the water-cooled DSC 600 system, it achieves rapid furnace cooling, significantly enhancing experimental efficiency.
  • Gas Selector Accessory
  • The gas selector supports one-button switching across multiple gases, accommodating up to 4 input ports. It simplifies valve disassembly and assembly when sampling different gases, effectively minimizing leakage risks associated with manual handling. Additionally, the instrument features an automatic purging process, ensuring efficient gas line purification and seamless, automated switching between gases.

PDSC

  • Pressure Differential Scanning Calorimeter
  • The Pressure Differential Scanning Calorimeter (PDSC) is capable of conducting calorimetric tests under both high and low-pressure conditions. In practical applications, many raw materials and finished products are processed or used under high temperature and high pressure, making it essential to understand their performance under these extreme conditions. While traditional calorime-ters are effective in characterizing the physical and chemical properties of materials, the PDSC extends this characterization to extreme pressure environments. It allows for an in-depth analysis of the heat flow changes during phase transitions and chemical reactions under high or low pressure.
  • In a sealed crucible, changes in internal pressure can cause DSC test results to differ from those obtained under atmospheric pressure. The PDSC enables precise pressure control, which allows researchers to investigate the effects of varying pressures on samples and uncover thermal behavior differences in different environments. For material research in extreme test conditions, the PDSC offers superior capabilities in characterizing heat changes during reaction processes.
  • At the core of the PDSC is a high-performance heat flow sensor platform, specifically designed to study minute energy changes and the relationship between energy, temperature, and pressure.
  • Temperature Range -150-600°C
    Maximum Pressure 1000 psi
    Program Rate 0.1-200°C/min
    Gas Nitrogen, Argon, Helium, Compressed air, Oxygen, etc.

AMI Thermal Analysis Series Products

  • Differential Scanning
    Calorimeter
    (DSC)
  • Thermogravimetric
    Analyzer
    (TGA)
  • Simultaneous Thermal
    Analyzer
    (STA)
  • Thermomechanical
    Analyzer
    (TMA)


TGA 1000/1200/1500

INTRODUCTION

  • The TGA Series combines research-grade capabilities with an accessible price point, delivering high-performance thermal analysis tools without compromising on quality. Equipped with advanced high-sensitivity microbalances and compact, state-of-the-art furnaces, these instruments provide unparalleled precision, drastically reduce buoyancy effects, and ensure superior temperature responsiveness.
  • Renowned for their reliability and versatility, the TGA Series instruments are trusted across a wide range of industries, including plastics, rubber, adhesives, fibers, pharmaceuticals,environmental energy, petrochemicals, and food science. These instruments meet critical customer needs by enabling the characterization and analysis of parameters such as material decomposition temperatures, mass loss percentages, component contents, and residual mass.
  • TGA 1000/1200/1500

FEATURES

  • Proprietary Microbalance
  • The proprietary TGA microbalance combines high sensitivity, low drift technology, and thermal insulation design to deliver exceptional weighing accuracy. With a resolution as precise as 0.1 μg, it is ideal for high-precision measurements of trace samples. The low-drift technology minimizes the impact of environmental factors, ensuring stable data even in long-duration experiments, while reducing errors caused by drift. Additionally, the thermal insulation design protects the balance from external temperature fluctuations, maintaining internal temperature stability and ensuring reliable results, even in conditions of rapid temperature change or high heat.
  • Miniature Furnace
  • The compact heating furnace is designed to significantly minimize gas buoyancy effects, ensuring that dynamic curve drift in TGA remains under 25 μg without requiring additional blank tests. Additionally, the furnace delivers a rapid temperature response, achieving heating rates of up to 300°C/min, which dramatically shortens experimental time and enhances overall work efficiency.
  • Precise Temperature Control
  • The advanced heating technology combined with a dual PID control system ensures precise adherence to the set temperature curve during both heating and cooling processes. With a temperature control accuracy of ±0.1°C, this system significantly reduces the influence of temperature fluctuations, delivering highly reliable experimental results.
  • Wide Temperature Range
  • Multiple furnace options are available to meet the specific temperature requirements of different materials. With a maximum temperature capability of up to 1500°C, these furnaces are designed to satisfy the rigorous demands of both experimental and industrial applications.
  • Furnace Auto-Lift System
  • The instrument is equipped with an automatic furnace lifting system, simplifying experimental operations and preventing equipment damage or safety incidents caused by improper manual handling.
  • Water Cooling System
  • The fully automated recirculating bath provides precise and continuous temperature control, which effectively and rapidly reduces the TGA furnace temperature, significantly shortening the experimental time.
  • Automatic Gas Switching Control
  • The gas selector supports one-button switching across multiple gases, accommodating up to 4 input ports. The device features an integrated design, consolidating four gas channels into a single module to meet the need for frequent gas switching during different testing processes.
  • Evolved Gas Analysis
  • TGA can be combined with other analytical instruments for online monitoring and qualitative analysis of evolved gases, such as mass spectrometers (MS) or Fourier-transform infrared spectrometers (FTIR).

SOFTWARE

  • Experiment Program Setup Interface
  • Standard Functions
  • · 2-point or 6-point mass loss analysis
  • · Peak temperature analysis
  • · Weight loss step analysis
  • · Mass loss initiation point
  • · Residual mass calculation
  • · 1st and 2nd derivative analysis
  • · Data smoothing
  • ·Baseline subtraction
  • Optional Functions
  • High-Resolution thermogravimetric analysis:
    Enables effective separation of overlapping mass loss regions, improving resolution, and quickly obtaining experimental data over a wide tempera-ture range.

MATERIALS

  • Petrochemical products
  • Coal and other fuels
  • Explosives
  • Cosmetics
  • Thermoplastic materials
  • Thermosetting materials
  • Rubber
  • Coatings
  • Elastomers
  • Polymers
  • Pharmaceuticals
  • Food Products
  • Catalysts
  • Chemicals
  • Asphalt
  • Ceramics

SPECIFICATIONS

Temperature Range RT-1000°C RT-1200°C RT-1500°C
Temperature Accuracy ±0.5°C
Temperature Precision ±0.1°C
Program Rate 0.1-300°C/min 0.1~60°C/min
Cooling Mode Water Cooling
Resolution 0.1 μg
Measuring Range ±200 mg
Dynamic Baseline Drift ≤ 25 μg (No blank background subtraction)
Isothermal Baseline Drift ≤5 μg/h
Repeatability ≤10 μg
Weight 44 lbs.
Dimensions 16.3 in(W) × 14 in(D) × 16.6 in(H)
  Options
Gas Controller 4 Channel Automatic Gas Switching
Evolved Gas Analysis MS,FTIR,etc.

APPLICATIONS

  • Typical Applications
  • Thermal Stability
  • Thermal Pyrolysis
  • Oxidation Reactions
  • Dehydration Process
  • Decomposition
  • Process Kinetics
  • Combustion Process
  • Moisture Content
  • Residue and Ash Content
  • Dynamic Baseline Drift
  • In a typical TGA test, the sample mass may increase due to the "buoyancy effect" of the gas. However, the design of the miniature heating furnace ensures that the drift of the dynamic thermogravimetric curve remains below 25 μg, eliminating the need for baseline curve subtraction.
  • Weight Loss Step Analysis
  • The analysis software enables clear observation of the weight loss ratio and corresponding temperatures at each stage of the process. For instance, the thermogravimetric curve of hydrated calcium oxalate demonstrates three distinct stages. In the first stage, bound water evaporates, producing water vapor and leaving behind calcium oxalate. In the second stage, calcium oxalate decomposes into calcium carbonate and carbon monoxide. Finally, in the third stage, calcium carbonate further breaks down into calcium oxide and carbon dioxide.
  • High-Resolution TGA
  • The high-resolution TGA technology intelligently adjusts the heating rate in response to the sample's decomposition rate,effectively separating overlapping mass loss regions and enhancing resolution. This enables the rapid collection of experimental data across a wide temperature range. The exceptional resolution achieved with this advanced technology is particularly beneficial for analyzing the mass loss curve in TGA and the first derivative signals (DTG), providing highly detailed and accurate results.

ACCESSORIES

  • Crucibles
  • Crucibles serve as sample containers in thermal analysis measurements, effectively protecting sensors and preventing measurement contamination. The selection of crucible type is critical for result quality. We offer various crucible options to meet different testing requirements, ensuring accurate and reliable measurement results.
  • Mass Spectrometer
  • The Online Gas Mass Spectrometer is a quadrupole mass spectrometer specifically designed for the efficient collection and analysis of TGA evolved gases, with a mass range of 1-300 amu. It offers sensitivity at the parts-per-billion (ppb) level, ensuring precise analysis of low-concentration gases.
  • Fully Automated Chiller
  • The fully automated recirculating bath enables precise continuous temperature control within the range of -10°C to 90°C. When coupled with the water-cooled DSC600 system, it achieves rapid furnace cooling, significantly enhancing experimental efficiency.
  • Gas Selector Accessory
  • The gas selector supports one-button switching across multiple gases, accommodating up to 4 input ports. It simplifies valve disassembly and assembly when sampling different gases, effectively minimizing leakage risks associated with manual handling. Additionally, the instrument features an automatic purging process, ensuring efficient gas line purification and seamless, automated switching between gases.

AMI Thermal Analysis Series Products

  • Differential Scanning Calorimeter(DSC)
  • The DSC is a device used to measure the energy changes absorbed or released by a sample during variations in time or temperature. The DSC sensor is a heat flow measurement platform employing specialized technology, designed to deliver exceptional performance and testing reliability. Examples of measurements conducted using DSC include enthalpy of melting, glass transition, crystallization, purity, and specific heat capacity.
  • Thermogravimetric Analyzer(TGA)
  • The TGA measures changes in the weight of a sample as a function of temperature or time. This product supports the editing of multiple program segments, allowing for the design of complex experiments involving heating, cooling,or isothermal conditions. It also features automatic gas switching during temperature ramps, while its vertical supension design ensures stable and accurate weight readings throughout the experiment. The TGA's micro-furnace provides rapid response to temperature changes and enables quick cooling between multiple experiments.
  • Simultaneous Thermal Analyzer(STA)
  • AMI introduces anew generation of high-performance STA, featuring a microbalance with 0.1 μg resolution, advanced control algorithms, and structural design. The STA is ideally suited for evolved gas analysis, capable of precisely capturing minute mass changes and thermal effects. It is also equipped with an atmosphere control system that provides specific gas environments, aiding in the simulation of real-world conditions. The STA is flexibly configurable to meet all your specific thermal analysis testing needs.
  • Thermomechanical Analyzer(TMA)
  • Thermal expansion is a primary cause of mechanical stress and electronic component failure. The TMA can accurately determine the glass transition temperature and stress relief points of materials, identify critical points that may lead to delamination, and ensure the stability of electronic performance. This new thermomechanical analyzer features a simple and robust design, specifically tailored for measuring the expansion of small components and the low expansion rates of circuit boards and component materials.


STA 650 1000 1200 1500

INTRODUCTION

  • AMI is pleased to introduce its next-generation Simultaneous Thermal Analyzer (STA), a state-of-the-art instrument designed for advanced thermal analysis. Incorporating a 0.1-microgram balance resolution, sophisticated control algorithms, and an innovative hang-down design, this analyzer delivers exceptional precision and reliability in an affordable, high-performance system.
  • The STA Series enables simultaneous Thermogravimetric Analysis (TGA) and Differential Scanning Calorimetry (DSC)/Differential Thermal Analysis (DTA) on a single sample within a single run. Built for reliability and precision, the STA delivers comprehensive thermal profiles without the need to run multiple experiments—saving you both time and sample material.
  • Engineered for quality control, routine testing, academic research, and industrial R&D, the STA Series combines robust construction with user-friendly intuitive software, offering a cost-effective solution for high-precision thermal analysis.
  • The STA is controlled by the Infinity Pro Thermal Analysis software. This unique Windows based software offers a very simple interface with all the features you need to analyze your thermal data.
  • STA Simultaneous Thermal Analyzer

MATERIALS

  • ● Polymers
  • ● Chemicals
  • ● Petrochemicals
  • ● Polymorphs
  • ● Superconductors
  • ● Ceramics
  • ● Glasses
  • ● Composites
  • ● Metals
  • ● Engineered alloys
  • ● Pharmaceuticals
  • ● Catalyst Research
  • ● Building Materials
  • ● Propellants
  • ● Explosives
  • ● Electronic Components
  • ● Coals & other fuels
  • ● Catalysts
  • ● Nuclear Science Materials
  • ● Food and Biomaterials

FEATURES

  • True Hang-Down Balance Design
  • Industry-leading stability, sensitivity, and long-term drift resistance for reliable and repeatable measurements without the need for buoyancy corrective experiments.
  • High Sensitivity Microbalance
  • Sub-microgram-level accuracy across a broad temperature range, providing confidence in your thermal and mass loss data.
  • 24-Bit Resolution
  • High-precision measurement of temperature, delta T, and weight with minimal noise and high digital fidelity.
  • Small Swept Volume Furnace Cup (7.5mL)
  • Enhances temperature uniformity and gas exchange efficiency.
  • Simultaneous TGA/DSC or DTA
  • Perform thermogravimetric and calorimetric analyses in a single run— ideal for decomposition, oxidation, and phase transitions.
  • Dual Purge Gas System
  • Separate channels for purge and protective gases allow for fine control of the experimental atmosphere.
  • Broad Temperature Range
  • Furnace operation up to 1500°C under inert, oxidizing, or reducing gas environments.
  • Motor-Driven Furnace Lift
  • Ensures automated, smooth movement of the furnace for consistent sample positioning.

OPTIONS

  • Evolved Gas Analysis (EGA) Compatibility
  • Interface with mass spectrometry (MS) or FTIR systems for evolved gas studies during thermal decomposition.
  • 4-Gas Selector System
  • Automates delivery of up to four different gases for programmable switching during analysis.
  • Sub-Ambient System (650°C Model)
  • Low-temperature furnace models support experiments starting below room temperature
  • High-Temperature Flexibility
  • Optional DSC-only high-temperature mode to allow DSC-only to 1,500°C
    Optional TGA-only high-capacity mode for larger or reactive samples

EXAMPLES

  • Barium Chloride
  • This is an example of a reference material that shows temperature and enthalpy accuracy. In addition, this represents a good example of a fused peak analysis.
  • Calcium Oxalate
  • Calcium Oxalate is an excellent demonstration material for both DSC and TGA. This sample was run in the presence of Oxygen. The first DSC peak has an associated weight loss and represents bound water.
  • STA data analysis

SPECIFICATIONS

  • Temperature -40°C-650°C Ambient to 1200°C Ambient to 1500°C
    Programmed Rate 0.1-100 °C/min 0.1-40 °C/min
    DSC Sensitivity <1 μW <4 μW
    TGA Range 400 mg
    TGA Readability 0.1 μg
    Thermocouple Type K Type R
    DSC/DTA mode Yes

TMA 800

INTRODUCTION

  • The TMA 800 is built on a proven vertical design that incorporates an advanced Oil Float Suspension System, delivering the stability and precision required for accurate measurement of thermal expansion, glass transition, and other thermomechanical properties across a wide range of materials.
  • Engineered for both performance and ease of use, the TMA 800 provides exceptional data quality for analyzing coefficients of thermal expansion (CTE), stress relaxation, and dimensional change. It is ideally suited for high-reliability applications in electronics, composites, advanced polymers, and more. With a wide operating temperature range from -90 °C to 800 °C and multiple test modes available, the TTMA 800 offers outstanding versatility to meet a broad range of application needs.
  • Thermal expansion is a primary cause of mechanical stress and failure in electronic components, PCB assemblies, and multilayer structures. Accurately determining the glass transition temperature—the point at which softening and stress relief begin—or the onset of delamination is critical to product development, performance, and reliability in thermal environments.
  • The TMA 800 is a rugged, easy-to-use system designed for both routine testing and advanced research. It features a motorized furnace lift for smooth, safe repositioning after loading, with integrated position sensors to ensure operator protection. Its all-metal furnace is built to deliver thousands of hours of failure- free performance, while its vertical geometry supports samples ranging from a few microns to over a centimeter tall—ideal for measuring both small components and low-expansion materials such as circuit boards.
  • Whether you're characterizing high-performance materials or qualifying components for harsh service environments, the TMA 800 offers the accuracy, reliability, and usability demanded by today’s materials labs.
  • TMA 800

FEATURES

  • True Vertical Alignment for Accuracy
  • Unlike most TMA units that use U-shaped geometry for convenience, the TMA 800 features a direct, vertical in-line design. This configuration minimizes friction, ensures uniform force application, and reduces noise and sample deformation—delivering superior measurement precision.
  • Oil Float Suspension System (Exclusive to the TMA 800)
  • During softening or transition, even slight mechanical noise or unintentional force can distort results. The Oil Float Suspension System supports the full weight of the probe and force coil, ensuring that only the intended force is applied. This system also dampens external vibrations, ensuring greater accuracy and protection of delicate materials.
  • Interchangeable Probes & Sample Holders
  • Easily switch between expansion, flexure, and penetration probes to meet a wide range of testing requirements. A specialized accessory allows for convenient mounting of films, fibers, and other delicate specimens, supporting industry-standard testing methods.
  • Advanced, Computerized Operation
  • The TMA 800 is fully computerized, with most functions controlled via an intuitive software interface. The pre-calibrated temperature sensor provides precise temperature readings, and calibration routines are straightforward—even for fast-scanning or complex samples. Software capabilities include:
  • • Real-time data display
    • Automatic zeroing and sample height reading
    • Curve optimization and overlay
    • Program archiving, comparison, and automated calculations
  • Cross-section of the TMA
  • The TMA 800 is an outstanding solution for laboratories seeking a cost-effective yet high- performance instrument to meet regulatory requirements for thermal expansion—especially in electronics, aerospace, composites, and other sensitive industries where dimensional stability is critical. Here are a few ways the TMA 800 is engineered for precision thermal analysis:
  • • The cold sink surface is cooled by a heat exchanger that easily connects to an external chiller using a single-bolt attachment, simplifying low-temperature operation.
    • The 40 mm furnace height provides an exceptionally wide and uniform temperature zone, ensuring consistent heating across the full sample length.
    • A high-resolution Linear Variable Differential Transformer (LVDT) sensor offers both the sensitivity to detect micron-level changes and the range to track large dimensional shifts.
    • The submerged float supports the full weight of the sample probe and core rod while dampening external vibrations and protecting sensitive quartz components.
    • The core rod and probe are fully supported by AMI’s unique Oil Float Suspension System, delivering friction-free motion and unmatched force control during softening transitions.
  • Whether you're focused on glass transition detection, CTE measurement, or structural deformation, the TMA 800 is optimized to deliver the accuracy, repeatability, and confidence your lab demands.

SPECIFICATIONS

  • Model TMA 800
    Isothermal Stability ± 0.4 °C
    Probe control Oil float System and Electronic Force
    Thermocouple Type Type K Nickel-Chromel
    Temperature Range Ambient °C to 800 °C (-80 °C to 800 °C with RCS System)
    Temperature Program 0.1 °C/min to 60 °C/min
    Temperature Accuracy 1°C
    Temperature Precision 1°C
    Maximum Sample Size Up to 10 mm in length
    Maximum Load 2N
    Cooling System Water Cooling (Standard); RCS Cooling (Option)
    Testing Geometries Expansion, Tensile, Penetration, 3 Point Bending, Compression, Dilatometer
    Power Requirements 100-120/220-240V, 60 / 50Hz
    Options Multi-channel Gas Inlet Controller (Gas switching for up to four gases)
  • TMA Data


Lattice Series

INTRODUCTION

  • The Lattice Series redefines benchtop X-ray diffraction by combining high-power performance with compact design. Equipped with a powerful 600 W (Lattice Mini) or 1600 W X-ray source and a high-efficiency, direct-read 2D photon detector, the Lattice Series delivers exceptional data intensity and accuracy—making it ideal for demanding analytical environments.
  • Available in three configurations—Lattice Mini, Lattice Basic, and Lattice Pro—this series accommodates a wide range of technical and budgetary needs, from simple phase identification to complex in-situ studies. All models offer excellent signal-to-noise ratio and fast scan speeds, providing lab-grade data from a desktop system.
  • Whether you're analyzing complex powders, crystalline materials, or conducting highthroughput measurements, the Lattice Series provides lab-grade results with speed, power, and precision—all in a desktop footprint.
  • Lattice Series Instrument

MODEL SERIES

  • The Lattice Mini is the ideal entry point for high-quality X-ray diffraction. Designed for users who need reliable phase identification and material characterization in a truly space-saving format, the Lattice Mini delivers powerful performance in a compact, affordable package.
  • Ideal for:
  • • University and teaching laboratories
    • Small research groups
    • Routine QA/QC in ceramics, metals, and minerals
    • Rapid phase screening and basic material studies
  • The Lattice Basic is designed for laboratories that require dependable, high-throughput diffraction without the complexity of advanced custom configurations. With high angular resolution and a direct-read 2D photon detector, the Lattice Basic delivers fast, accurate results across a wide range of powder samples. It’s an excellent choice for users who prioritize precision, speed, and reliability—at an efficient price point.
  • Ideal for:
  • • QA/QC labs
    • Materials characterization
    • Educational and institutional research
    • Cement, ceramics, metals, and pharmaceuticals
  • The Lattice Pro is built for the most demanding applications. Featuring Theta–Theta geometry for enhanced sample stability and accessory support, it enables precise, high-performance analysis for advanced materials, coatings, and stress testing.
  • Ideal for:
  • • Advanced R&D environments
    • Dynamic experiments
    • Residual stress analysis
    • Film, coating, and thin-layer characterization
    • Battery and energy materials research

KEY FEATURES

  • • High-Power X-ray Source
  • Choose between 600 W or 1600 W configurations for high-intensity data collection and rapid scanning.
  • • 2D Photon Direct-Read Detector
  • A 256 × 256 pixel array captures sharp, high-resolution diffraction patterns with an excellent signal-to-noise ratio.
  • • Exceptional Angular Accuracy
  • Achieve step sizes as small as ±0.01° 2θ and ensure a consistent peak matching with standard reference materials.
  • • Flexible Goniometer Options
  • Theta–2Theta geometry for standard analysis (Mini & Basic) or Theta–Theta for enhanced sample stability (Pro).
  • • Fast, Reliable Scanning
  • Obtain full-spectrum data in minutes—ideal for routine QA and high-throughput labs.
  • • Compact Benchtop Design
  • Fits seamlessly into modern lab environments without sacrificing performance or requiring floor space.
  • • Expandable Functionality (Lattice Pro)
  • Supports advanced modules for residual stress testing, high-temperature stages, in-situ battery studies, and thin film analysis.
  • • User-Friendly Operation
  • Intuitive software and streamlined hardware design simplify training and daily use.

PERFORMANCE EXAMPLES

  • Miller Indices Theoretical Peak Measured Peak Difference
    Position Position
    012 25.579 25.577 0.0020
    104 35.153 35.15 0.0030
    116 57.497 57.497 0.0000
    1010 76.871 76.872 0.0010
    0210 88.997 88.996 -0.0010
    0114 8116.612 116.61 -0.0020
  • Comparison of Theoretical Peak Positions and Measured Peak Positions for Corundum Standard Sample
  • Instrument Repeatability Measurement
  • XRD Spectrum of Ternary Materials Black represents regular measurement mode data, and blue represents fluorescence-free mode data.
  • Test Data for Corundum Powder (10°/min)
  • Graphitization Degree Measurement
  • Measurement Spectrum for Silicon Nitride Ceramic
  • Reflective In-Situ Battery Measurements

TECHNICAL PARAMETERS

  • Model Lattice Mini Lattice Basic Lattice Pro
    X-ray tube 600 W 1600 W
    X-ray tube target material Standard Cu target, Co target is optional
    Theodolite Theta / 2theta geometry, the radius of the theodolite is 158 mm Theta / 2theta geometry, the radius of the theodolite is 170 mm Theta / theta geometry, the radius of the theodolite is 170 mm
    Maximum scanning range -3 - 156°
    Theta Minimum step size ±0.01°
    Detector Photon direct-read two-dimensional array detector
    Detector energy resolution 0.2
    Volume and Weight L 25.6 in (650 mm) × W 19.7 in (500 mm) × H 15.8 in (400 mm), 132 lbs (60 kg) L 35.5 in (900 mm) × W 26.8 in (680 mm) × H 21.7 in (500 mm), 220 lbs (100 kg)
    Sample stage Standard chip stage
    Options N/A Five-bit injector; In situ battery test accessories; SFive-bit injector; In situ battery test accessories; High temperature sample station: can be customized according to customer requirements, e.g., RT-600°C/RT- 1000°C; Residual stress measuring fixture (can be customized); Film sample stage: Size: 2.4 in (60mm) × 2.4 in (60mm) (can be customized)