Advanced Measurement Instruments
Copyright © 2025 Advanced Measurement Instruments
Building on our previous overview of SSITKA (Steady-State Isotopic Transient Kinetic Analysis), this article delves into the core principles and computational methods behind the technique. In addition, it explores how SSITKA can be integrated with in situ infrared spectroscopy to provide deeper insight into surface reactions and active site behavior.
The schematic diagram of the SSITKA experimental setup is shown in Figure 1 [1]. It consists of three main components: a gas flow control system, a reactor, and a mass spectrometer. The gas flow system must support steady-state transient operation, enabling rapid and stable switching between isotopic feeds. It is also essential that both the pre- and post-switch conditions are well-defined and reproducible. The mass spectrometer must be capable of fast response to accurately capture transient signals.
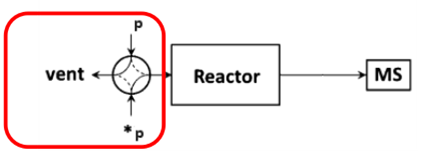
Figure 1 Schematic Diagram of SSITKA Experimental Device
Most SSITKA experiments today rely on microreactor-based systems that are either manual or semi-automated, often leading to operator-induced variability. The AMI 300TKA system addresses this challenge by enabling fully integrated SSITKA experiments through dedicated gas circuit design and coupled mass spectrometry, as shown in the software interface in Figure 2. Transient switching is achieved using a four-way valve, which alternates between two feed streams: Aux Gases and Blend Gases. These streams introduce either the unlabeled reactant (12CO) or the isotopically labeled reactant (13CO). Upon valve switching, the system seamlessly transitions from 12CO to 13CO under steady-state conditions.
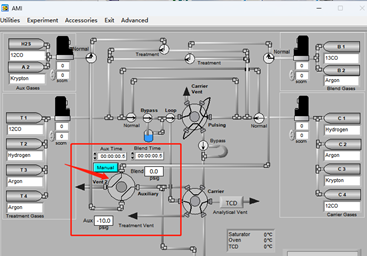
Figure 2 Software Interface of AMI 300TKA
SSITKA experiments can be executed automatically following the program shown in Figure 3. The fully automated process eliminates the need for manual intervention, significantly reducing the risk of human error and improving the accuracy and reproducibility of test results. The procedure is both practical and user-friendly, ensuring reliable operation even for complex transient kinetic studies.
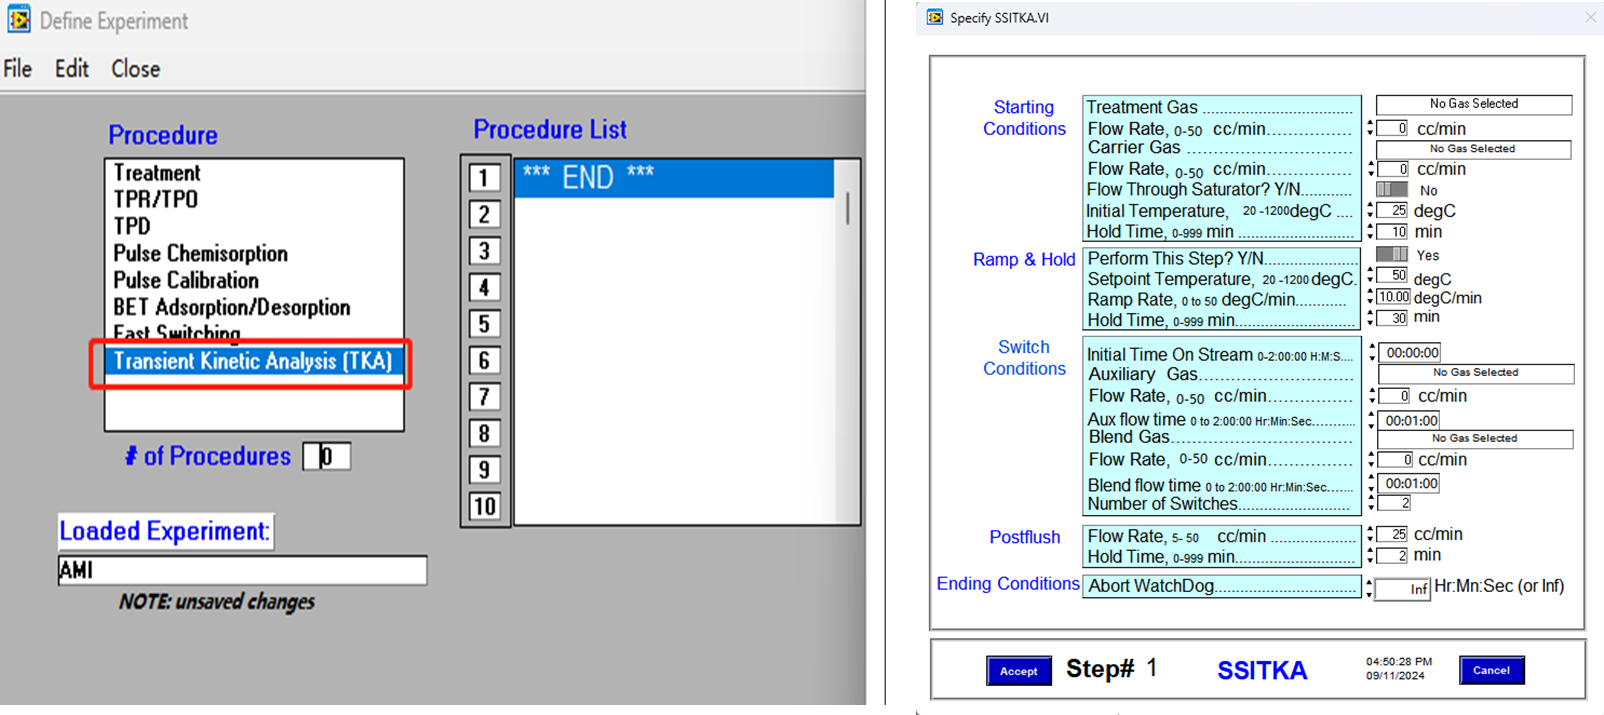
Figure 3 Kinetic Parameter Solving of SSITKA Program Setting of SSITKA on AMI 300TKA
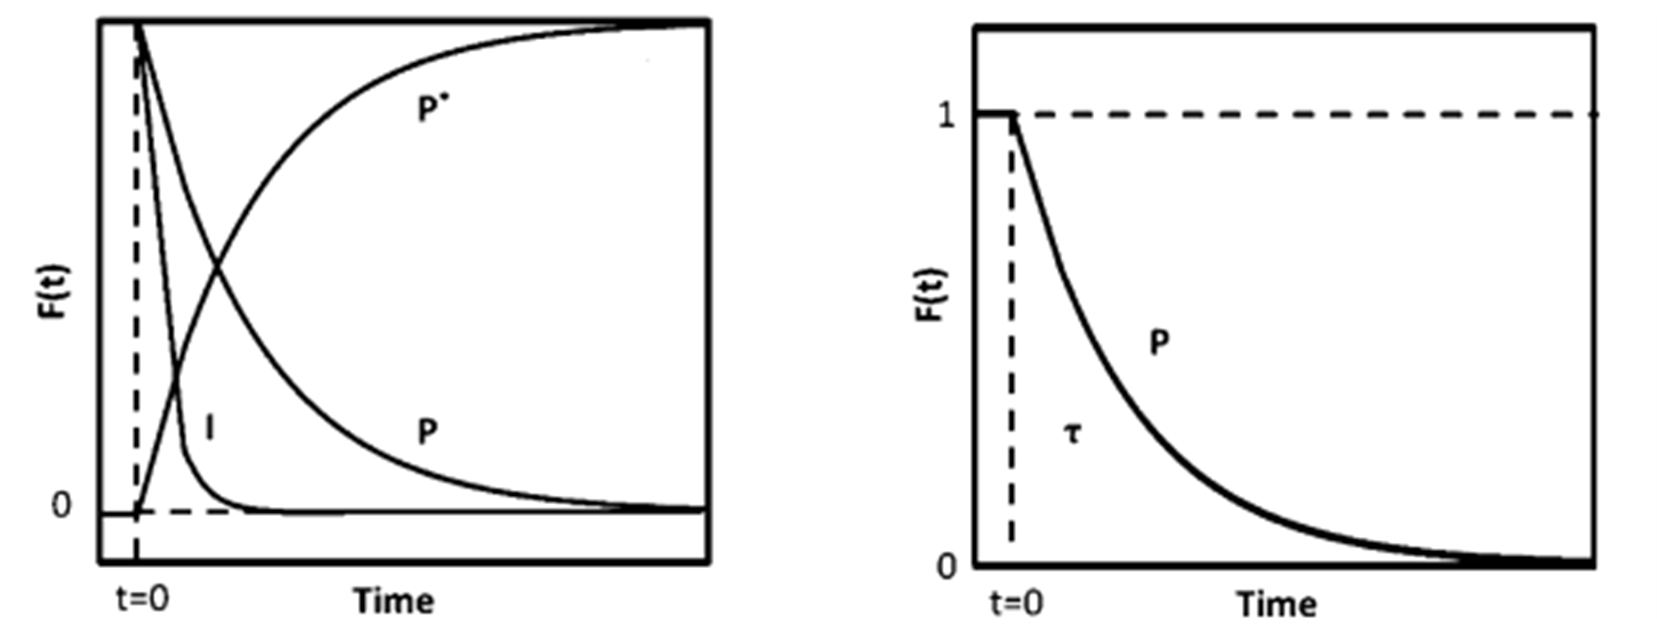
Figure 4 (a) Mass Spectrum (b) Transient Response Curve
Without making kinetic assumptions or defining surface reaction mechanisms, two key parameters can be directly extracted from the transient response curve: the surface residence time (or surface lifetime) τₚ of the intermediate species that form product P, and the surface coverage Nₚ of those intermediates. The expression for calculating Nₚ is given below [2]:

During the experiment, the reactants were rapidly switched while maintaining a constant reaction rate. The reaction rate of the unlabeled product was determined using the following equation [3], where rₚ(t) represents the steady-state reaction rate of the unlabeled product, and rₚ(t) denotes the reaction rate of the isotopically labeled product.

rₚ(t) is the steady-state reaction rate of the unlabeled product, and rₚ(t) is the reaction rate of the isotopically labeled product. As shown in Figure 4(b), normalizing the decay of the unlabeled product yields the transient response curve. The expression for Fₚ(t) is given as follows:

By rearranging and calculating the above three formulas, the surface residence time τP of the intermediate species can be obtained.

Integrating the transient response curve yields the surface residence time τP, as shown in Figure 5.
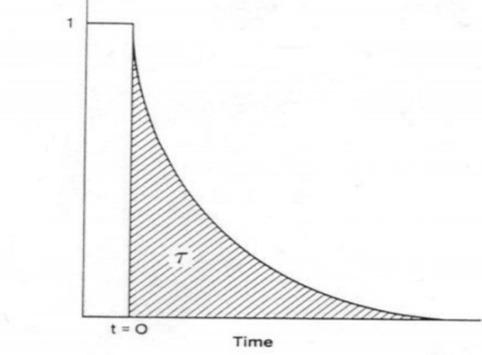
Figure 5 Surface Residence Time τP
The surface coverage (θ) of intermediates, the reaction rate constant (k), and the turnover frequency (TOF) are calculated using chemisorption techniques to determine the total number of exposed metal atoms (Nₐ) on the catalyst surface.
![]()
Assuming that the chemical reaction on the surface is pseudo-first-order, the rate equation of the pseudo-first-order reaction can be expressed as:
![]()
Thus, the pseudo-first-order reaction rate constant is obtained:
![]()
TOF (turnover frequency) represents the number of catalytic reactions occurring per unit time per active site. It reflects the catalyst’s instantaneous efficiency based on the number of surface active sites. The formula is as follows:
![]()
Here, θ represents the surface coverage of intermediate species. The number and distribution of active sites on the catalyst surface can be analyzed using deconvolution techniques, enabling further investigation into the kinetics and mechanism of the catalytic reaction.
1.2.2 Modeling of SSITKA
A heterogeneous catalytic reaction often proceeds through one or more surface-bound intermediate steps. The general parameters introduced earlier—τₚ (the total surface residence time of intermediate species) and Nₚ (the total quantity of surface intermediates leading to product P)—represent the overall behavior of all intermediates involved in forming product P. To distinguish the contribution of individual intermediates, Shannon [4] and Chen et al. [5], building on the work of Biloen et al. [6], proposed a surface reaction mechanism model, summarized in Table 1. This model categorizes reactions into reversible and irreversible types, and further into cases involving single, sequential (series), parallel, or more complex arrangements of intermediate species. Based on these classifications, transient response models were derived using material balance principles. These models allow for the extraction of dynamic parameters such as the quantity and residence time of each intermediate species involved in producing product P.
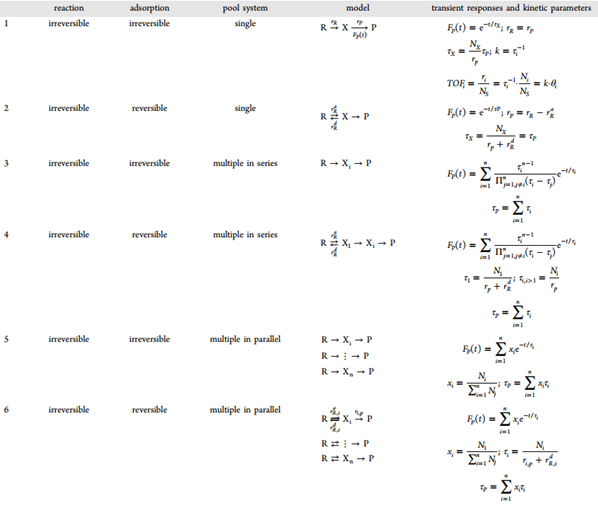
Table 1 [7]: Mechanism Model, Transient Response, and Kinetic Parameters Obtained from SSITKA
Kobayashi et al. [8] demonstrated experimentally that the shape of the transient response curve can provide insights into the underlying reaction mechanism. Building on this, Shannon et al. presented representative response profiles for different irreversible reaction pathways—specifically, cases involving a single intermediate, two intermediates in series, and two intermediates in parallel—as illustrated in Figure 6.
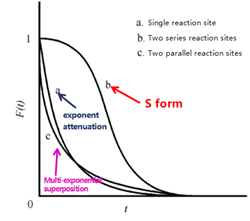
Figure 6 Schematic Diagram of Transient Responses for Different Surface Reaction Mechanisms
As shown in Figure 6, the transient response curves exhibit characteristic S-shaped profiles. Curve (b), which shows the slowest decay, corresponds to two sequential (serial) reaction intermediates—reflecting the extended time required for consecutive reactions at two sites. Curve (a), displaying a single exponential decay, represents a single intermediate species. Curve (c), with a multi-exponential decay pattern, corresponds to two parallel reaction intermediates, where the simultaneous operation of different reaction pathways leads to faster, overlapping decay components. By analyzing these distinct curve shapes, researchers can readily differentiate between kinetic models and infer the nature of surface reactions occurring on the catalyst.
In SSITKA experiments, both reactants and products can adsorb not only on the catalyst surface but also on the reactor walls and connecting pipelines, introducing a chromatographic effect. This effect can distort transient responses but may be minimized by reducing the distance from the four-way valve to the detector, increasing gas flow rates, and thermally insulating the transfer lines. The AMI-300TKA system addresses these challenges through the use of 1/16-inch tubing to reduce dead volume, thermal insulation of the valve box, and precise gas flow control via mass flow controllers—measures that collectively enhance measurement accuracy.
Additionally, product re-adsorption can significantly influence transient response data. When re-adsorption occurs at active sites, it reduces catalytic activity and lowers reaction rates. If it occurs at non-reactive sites, the activity remains unaffected, but the measured surface residence time of the product becomes artificially extended—combining the actual intermediate lifetime with the re-adsorption time. To correct for this, inert tracers and empirical correction formulas are commonly applied.

Where τinert is the surface residence time during inert gas response, x is empirically taken as 0.5.
SSITKA experiments are typically conducted under the assumption of steady-state conditions, with isotope effects considered negligible—that is, the kinetic behavior of isotopically labeled and unlabeled species is assumed to be identical. However, special attention is required when working with hydrogen and its isotopes (e.g., H/D), as the significant differences in mass and bond energy can lead to pronounced kinetic and thermodynamic effects. During H/D isotope exchange, changes in reaction rates and surface intermediates may disrupt steady-state conditions, potentially compromising experimental reliability. As a result, H isotope SSITKA experiments must be approached with caution. Despite these challenges, such experiments are valuable for probing surface reactivity, particularly in identifying bond cleavage events associated with adsorption, desorption, or reaction of specific molecular species.
SSITKA is a powerful technique for determining the abundance and kinetic parameters of surface intermediates. However, its primary limitation is the inability to directly characterize the chemical structure of these intermediates or observe their surface reactions in real time. In contrast, in situ infrared (FTIR) spectroscopy enables direct observation of adsorbed species under reaction conditions [9]. By integrating SSITKA with FTIR, it becomes possible to accurately identify surface intermediates—including their chemical structure and surface coverage—and to distinguish reactive adsorbed species from non-reactive ones [10]. Figure 7 shows the AMI-300SSITKA system developed by AMI, which combines SSITKA with in situ infrared spectroscopy for advanced surface characterization.
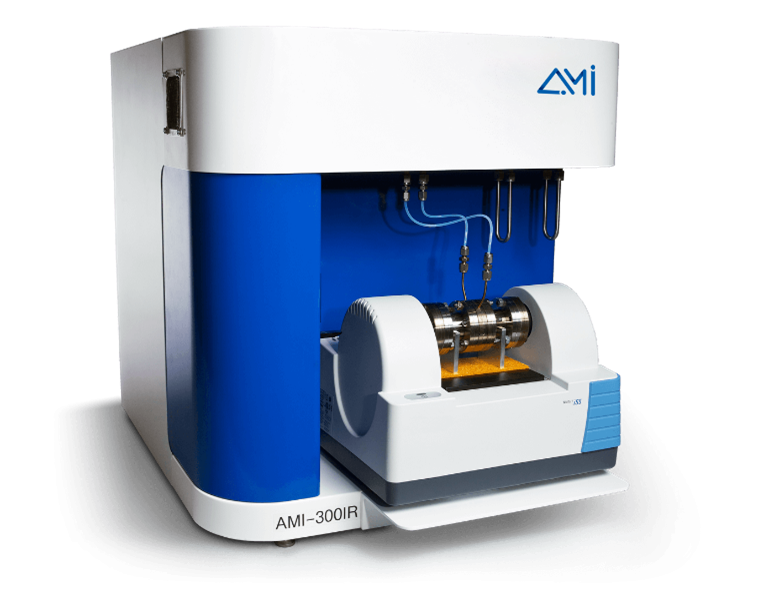
Figure 7 AMI-300TKA In-Situ Characterization
Since its development in the 1970s, SSITKA has been widely applied to investigate the mechanisms of numerous important industrial catalytic reactions. Today, the integration of SSITKA with spectroscopic techniques enables direct observation of surface intermediates and provides deeper insight into reaction mechanisms. Furthermore, combining SSITKA with complementary methods such as kinetic modeling and density functional theory (DFT) enhances our understanding of reaction pathways. The AMI-300SSITKA is the only commercially available SSITKA system that also serves as a fully featured chemisorption analyzer, offering unmatched versatility in a single platform. By leveraging the strengths of SSITKA alongside these advanced techniques, researchers can obtain a comprehensive picture of catalytic processes under true reaction conditions, facilitating the elucidation of complex chemical mechanisms.
References
[1] Li Chun-yi Shen Shi-hole transient mechanical analysis of steady-state isotopes [J] Advances in Chemistry, 1999,11(2):49-59.
[2] Recent Approaches in Mechanistic and Kinetic Studies of Catalytic, Cristian Ledesma, Jia Yang, De Chen, and Anders Holmen, ACS Catal. 2014, 4, 4527−4547.
[3] Anders Holmen, Jia Yang, and De Chen Springer Handbook of Advanced Catalyst Characterization, Springer Handbooks, Part VII Transient and Thermal Methods,2023,41,935 966.
[4] Shannon, S. L.; Goodwin, J. G. Chem. Rev. 1995, 95, 677−695.
[5] Berger, R. J.; Kapteijn, F.; Moulijn, J. A.; Marin, G. B.; De Wilde, J.; Olea, M.; Chen, D.; Holmen, A.; Lietti, L.; Tronconi, E.; Schuurman, Y. Appl. Catal., A 2008, 342, 3−28.
[6] Kondratenko, E. V. Catal. Today, 2010, 157, 16−23.
[7] Pansare, S.; Sirijaruphan, A.; Goodwin, J. G. In Isotopes in Heterogeneous Catalysis; Hutchings, G. J., Ed.; World Scientific Publishing Co.: London, 2006; Catalytic Science Series, Vol. 4, pp 183−206.
[8] Kobayashi H,Kobayashi M, Catal. Rev-Sci. Eng. 1974, 10, 139.
[9] Yokomizo G H, Bell A T, J. Catal., 1989, 119, 467—482.
[10] Efstathiou A M, Chafik T, Bianchi D et al. J. Catal., 1994, 148, 224—239.