High-Pressure Adsorption of Supercritical Carbon Dioxide using an MSB-Magnetic Suspension Balance

Download PDF
  1. Research Background

Carbon dioxide (CO₂) is a major greenhouse gas, and technologies for its capture and storage are central to combating climate change. Among the available approaches, adsorption using porous materials has gained significant traction due to its low energy demands and high efficiency. However, conventional CO₂ adsorption at ambient conditions suffers from low capacity and poor selectivity.

Supercritical CO₂ (scCO₂)—formed when CO₂ surpasses its critical point of 31.1°C and 7.39 MPa—exhibits a hybrid of gas and liquid properties: high diffusivity, tunable density, and low viscosity. These attributes make it uniquely useful in materials science, separation, and enhanced oil recovery (EOR).

FIGURE 1 – Phase Diagram of Supercritical CO₂

Geological Sequestration

scCO₂ geological sequestration is a widely recognized method for long-term CO₂ storage. Injecting scCO₂ into deep geological formations—such as depleted reservoirs and saline aquifers—allows CO₂ to be trapped through structural, solubility, or residual mechanisms. Mineral carbonation reactions further convert CO₂ into stable carbonate solids, significantly reducing the risk of leakage [1].

FIGURE 2– Investigation of CO₂ Adsorption under Normal vs. High Pressure

Enhanced Oil Recovery (CO₂-EOR)

EOR using scCO₂ serves both economic and environmental goals. When scCO₂ reaches miscibility pressure with crude oil (typically >10 MPa), it significantly reduces oil viscosity and improves flow characteristics.

EOR injection methods include:

  • Continuous injection
  • Water-Alternating-Gas (WAG)

scCO₂-EOR can increase recovery by 10–25% and extend oil field lifetimes by decades. In the U.S., such projects already sequester 30 million tons of CO₂ annually, or 1.5% of industrial emissions.

  1. Gravimetric Method for scCO₂ Adsorption

2.1 Why Magnetic Levitation?

Volumetric methods—though simple—require larger sample quantities and cannot effectively resolve kinetic behavior or low-pressure responses [2].

FIGURE 3 – Principle of Volumetric scCO₂ Testing

Gravimetric methods are preferred for high-precision adsorption work, but traditional balances suffer from:

  • Buoyancy effects (especially with large samples)
  • Balance drift
  • Inability to operate in extreme environments

AMI’s Magnetic Suspension Balance (MSB) overcomes these issues:

  • Operates under extreme temperatures and pressures
  • Transfers weight via non-contact magnetic coupling
  • Eliminates drift through periodic position switching
  • Corrects buoyancy using reference masses or known fluid densities.

FIGURE 4 – Magnetic Levitation Instrument Structure

  1. Application Cases

Case 1: Supercritical CO₂ Adsorption in Coal

High-pressure, high-temperature coal seams are ideal for CO₂ sequestration. Li and Ni et al. investigated the CO₂ adsorption behavior of Tunliu and Sihe coal under supercritical conditions [3].

FIGURE 5 – Isothermal Adsorption/Desorption Curves of Two Coal Types

Key Observations:

  • Adsorption capacity peaks then declines
  • Higher temperature = lower capacity
  • Sihe coal has greater uptake than Tunliu
  • Behavior follows Type I (IUPAC) isotherms before saturation [4]

However, corrections for excess vs. absolute adsorption and phase density assumptions are required to obtain true capacity data. Post-correction, adsorption shows stable increase with pressure and fully reversible desorption.

FIGURE  6– Density-Corrected Isotherms with Binary Langmuir Fitting

Case 2: Kinetics of scCO₂ Adsorption

Monitoring real-time uptake at fixed pressure provides kinetic insight. Adsorption is faster at higher pressure, but at supercritical pressures, adsorption approaches saturation more rapidly, reducing the number of available sites over time [5].

Studies by Charrière and Song show that:

  • Residual adsorption capacity declines with time
  • Fluctuations at high pressure are caused by density shifts near critical conditions [6][7]

FIGURE 7– CO₂ Residual Adsorption vs. Time at Various Pressures

Case 3: CO₂-EOR in Shale Reservoirs

Due to the complexity of core testing in shale (tight pore networks), magnetic levitation offers a direct and non-invasive method to monitor oil extraction.

Li and Chen used MSB readings at fixed intervals and compared results to NMR, showing strong correlation [8].

Table 1 – Comparison of Extraction Efficiency by Magnetic Levitation vs. NMR

With increasing CO₂ pressure:

  • Smaller pore throats are accessed
  • Extraction efficiency improves sharply until minimum miscibility pressure is reached

FIGURE  8– Pore Size Distribution of Tested Samples

  1. Experimental Validation

4.1 Conditions

  • Instrument: AMI Magnetic Suspension Balance
  • Calibration: Helium for volume and mass
  • Adsorbate: CO₂ up to 8 MPa
  • Temperature: 50°C
  • Sample Pretreatment: 200°C for 4 hours

4.2 Results

  • Adsorption peaked between 40–50 bar
  • Maximum uptake: 34.4%
  • Minimal deviation between repeated tests
  • Long equilibration times observed due to larger sample size
  • Recommended: narrow pressure steps for smooth isotherms

BET analysis showed (on AMI Instruments):

  • Surface Area: 1789 m²/g
  • Micropore Volume: 0.6 cm³/g

FIGURE 9 – Measured Supercritical CO₂ Adsorption Capacity

  1. Summary

Magnetic suspension gravimetric systems are essential tools for modern supercritical CO₂ adsorption research. Their advantages include:

  • High-pressure and temperature compatibility
  • Automatic elimination of drift via dual-position calibration
  • In-situ kinetic and isotherm measurements
  • Real-time buoyancy correction

Looking forward, future research should address:

  • Internal density gradients and convective turbulence
  • Adsorbent expansion corrections under extreme conditions

References

[1] Lv, Y., Tang, D., Xu, H., et al. CO₂ sequestration technology for improving coalbed methane recovery. Environmental Science and Technology, 2011, 34(5): 95–99.
[2] Sudibandriyo M., Pan Z., Fitzgerald J.E., et al. Langmuir, 2003, 19: 5323–5331.
[3] Li, Q., Ni, X., Wang, Y., et al. Coalfield Geology and Exploration, 2014, 42(3): 36–40.
[4] Fu, X., Qin, Y., Wei, C. Coalbed Methane Geology, China University of Mining and Technology Press, 2007.
[5] Charrière D., Pokryszka Z., Behra P. International Journal of Coal Geology, 2010, 81(4): 373–380.
[6] Song Y., Xing W., Zhang Y., et al. Adsorption, 2015, 21(1/2): 53–65.
[7] Siemons N., Wolf K.A.A., Bruining J. International Journal of Coal Geology, 2007, 72(3): 315–324.
[8] Li, B., Hou, J., Lei, Z., et al. Petroleum Drilling Technology, 2024, 52(4): 94–103.

Research on the Application of Breakthrough Curve Analyzers in Liquid Adsorbents for CO2 Capture

Download PDF

1. Introduction

Reducing atmospheric CO₂ concentrations remains one of the most pressing challenges in climate science and industrial decarbonization. Carbon Capture and Storage (CCS) has emerged as one of the most effective approaches for mitigating CO₂ emissions, with several core technologies under active development: membrane separation, solid adsorption, and liquid absorption.

Membrane separation relies on the selective permeation of gas molecules through materials such as inorganic or organic polymer membranes. Inorganic membranes (e.g., molecular sieves, porous ceramics) offer excellent chemical and thermal stability, but tend to have higher material and processing costs. Organic polymer membranes, while more economical, are limited by thermal

sensitivity, which restricts their use in high-temperature CO₂ capture scenarios.

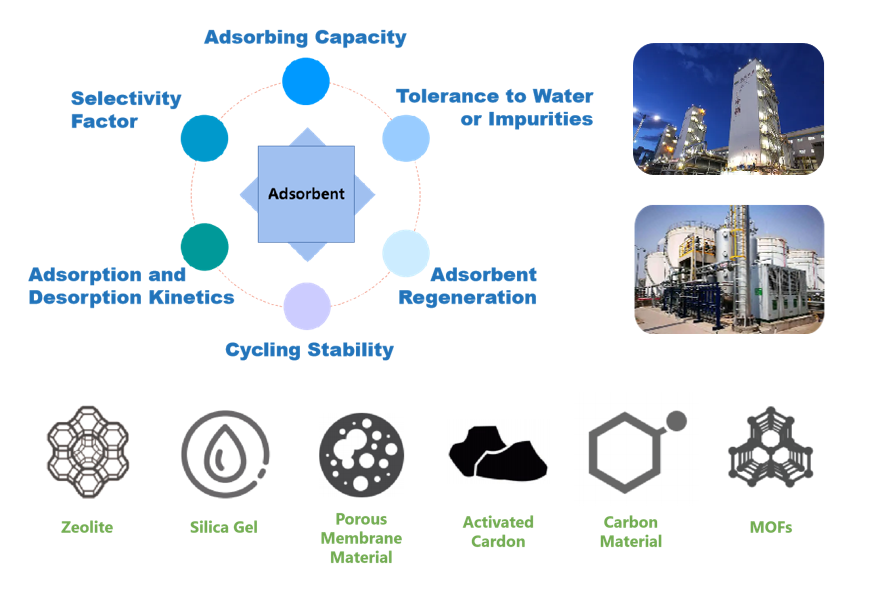
Solid adsorption captures CO₂ through interactions between gas molecules and the surface of porous materials. Two mechanisms are possible:

  • Physical adsorption, driven by van der Waals forces, typically results in lower heat of adsorption and capacity but offers easier regeneration. Common adsorbents include activated carbon, zeolites, mesoporous silica, and metal-organic frameworks (MOFs).
  • Chemical adsorption involves stronger interactions through electron transfer or bonding at basic surface sites, offering higher selectivity and greater adsorption heat. Materials such as lithium salts, metal oxides, and chemically modified porous solids are frequently used.

Liquid absorption can also be divided into physical and chemical categories.

  • Physical solvents like Selexol (polyethylene glycol dimethyl ether) and Rectisol (methanol) dissolve CO₂ without chemical reaction, providing good performance at low temperatures with relatively low energy consumption.
  • Chemical solvents, typically alkaline solutions such as ammonia, NaOH, KOH, or amine-based compounds, react with CO₂ to form carbonates, bicarbonates, or carbamates. These reactions are reversible under specific conditions, enabling CO₂ capture and release.

While chemical solvents offer high capacity and fast absorption rates, several legacy solutions (e.g., KOH and ammonia) face challenges related to equipment corrosion, volatility, and handling safety. Today, amine-based absorbents are the most widely used due to their favorable balance of reactivity, efficiency, and scalability in industrial CO₂ capture.

2. Reaction Mechanism

Organic amines, commonly used in chemical CO₂ absorption systems, contain hydroxyl (–OH) and amino (–NH₂, –NHR, –NR₂) functional groups. The hydroxyl group improves water solubility, while the amino group increases the solution’s pH, enhancing alkalinity and CO₂ absorption potential.

The fundamental mechanism is an acid-base neutralization reaction, in which the weakly acidic CO₂ reacts with basic amines to form a water-soluble salt. This reaction is temperature-dependent and reversible:

  • CO₂ absorption occurs at lower temperatures (30–60 °C)
  • Desorption (release of CO₂) occurs at higher temperatures (90–120 °C)

Amine Classification and Reactivity

Organic amines are classified by the number of hydrogen atoms substituted on the nitrogen:

  • Primary amines (–NH₂): e.g., monoethanolamine (MEA)
  • Secondary amines (–NHR): e.g., diethanolamine (DEA), diisopropanolamine (DIPA)
  • Tertiary amines (–NR₂): e.g., N-methyldiethanolamine (MDEA)

The binding strength of CO₂ with these amines generally follows the order:

Primary > Secondary > Tertiary

Primary and Secondary Amines: Carbamate Formation

The widely accepted zwitterion mechanism (Caplow, Danckwerts) describes a two-step reaction:

  1. Formation of Zwitterion Intermediate
    CO₂ + R₁R₂NH ⇌ R₁R₂NH⁺–COO⁻
  2. Deprotonation by a Base (B)
    R₁R₂NH⁺–COO⁻ + B ⇌ BH⁺ + R₁R₂NCOO⁻

Here, the zwitterion reacts with a base (e.g., amine, OH⁻, or H₂O) to form a carbamate. The strong C–N bond in the carbamate makes the product highly stable, but also leads to:

  • Reduced CO₂ loading capacity
  • Higher regeneration energy requirements
  • Slower desorption rates

Maximum loading for primary/secondary amines is typically 0.5 mol CO₂ per 1 mol amine.

Tertiary Amines: Bicarbonate Formation

Unlike primary and secondary amines, tertiary amines lack reactive hydrogen atoms and do not form carbamates. Instead, they enhance CO₂ hydration and facilitate bicarbonate formation:

  1. CO₂ + H₂O ⇌ H⁺ + HCO₃⁻
  2. H⁺ + R₁R₂R₃N ⇌ R₁R₂R₃NH⁺

This route results in:

  • Slower absorption rates
  • Lower capacity

2.1 Mass Transfer Mechanism of CO₂ Absorption

The mass transfer process involved in CO₂ absorption is commonly described using the two-film theory, first proposed by Whitman and Lewis. This model divides the gas–liquid interface into five distinct regions (see Figure 1):

The mass transfer process involved in CO₂ absorption is commonly described using the two-film theory, first proposed by Whitman and Lewis. This model divides the gas–liquid interface into five distinct regions (see Figure 1):

  1. Bulk gas phase
  2. Gas film (a stagnant boundary layer near the gas side)
  3. Gas–liquid interface
  4. Liquid film (a stagnant boundary layer near the liquid side)
  5. Bulk liquid phase

In the bulk gas and liquid phases, turbulence is typically high, ensuring uniform composition. However, as the gas and liquid phases approach the interface, they pass through their respective stagnant film layers, where molecular diffusion becomes the dominant transport mechanism.

The CO₂ absorption sequence follows these steps:

  • CO₂ diffuses from the bulk gas phase to the gas film surface
  • It then moves across the gas film by molecular diffusion
  • At the gas–liquid interface, CO₂ dissolves into the liquid
  • The dissolved CO₂ diffuses through the liquid film
  • Finally, it enters the bulk liquid phase, where the chemical reaction with the solvent (e.g., amine) occurs

While the two-film theory is widely used and provides a useful conceptual framework, it does have limitations. In systems with free interfaces or high turbulence, the interface becomes unstable and continuously disrupted. Under these conditions, the assumption of two steady, well-defined stagnant films on either side of the interface becomes less accurate. In such cases, convective mixing and interfacial renewal models may offer better descriptions of the actual transport dynamics.

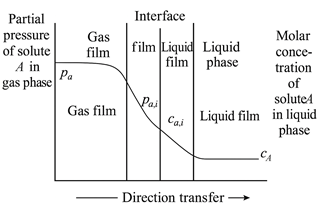
Figure 1 Schematic Diagram of the Two-Film Theory

2.2 Performance and Limitations of MEA-Based CO₂ Absorption

Monoethanolamine (MEA) is one of the most widely used absorbents for CO₂ capture. As a primary amine, MEA exhibits strong basicity and a low molecular weight, resulting in:

  • High reactivity
  • Rapid absorption kinetics
  • High CO₂ capacity per unit mass
  • Relatively low solvent cost

Due to these advantages, MEA-based absorption systems are commercially established and extensively deployed in both industrial and pilot-scale applications.

However, MEA is not without drawbacks. It has a high heat of reaction with CO₂, which translates to greater energy consumption during regeneration. MEA also tends to form stable amine carbonates and is prone to degradation when exposed to CO, sulfur compounds, or oxygen-containing gases, contributing to solvent loss and reduced operational efficiency.

Studies have shown that increasing MEA concentration improves CO₂ removal efficiency:

  • At 18 wt%, CO₂ removal is ~91%
  • At 30 wt%, it reaches ~96%
  • At 54 wt%, removal can exceed 98%

The improved performance is attributed to both increased vapor pressure and reaction enthalpy, which raise the temperature of the absorption solution. However, higher concentrations come with trade-offs:

  • Greater vaporization losses
  • Higher corrosion risk
  • Increased thermal degradation

For these reasons, MEA is most commonly used at ~30 wt% concentration, where performance and system stability are reasonably balanced. At higher concentrations, corrosion inhibitors are typically required.

Current research efforts are focused on:

  • Enhancing thermal and oxidative stability
  • Reducing energy consumption during regeneration
  • Developing modified or blended amine formulations to optimize performance and minimize drawbacks

2.3 Enhancing CO₂ Capture with Mixed Amine Solutions

To further improve CO₂ absorption efficiency and reduce energy consumption, blended alkanolamine solutions have become a key focus in solvent development. This strategy combines amines with high absorption capacity but slower kinetics with those offering faster reaction rates but lower capacity, aiming to strike an optimal balance between performance and regeneration efficiency.

By carefully selecting and mixing complementary amines, it is possible to enhance both the absorption and desorption characteristics of the solvent system. One promising approach involves blending monoethanolamine (MEA) with piperazine (PZ).

Research by Zhang Yaping [10] demonstrated that adding PZ to MEA significantly improves overall performance:

  • Absorption capacity increases with higher PZ content
  • Regeneration energy requirements decrease due to enhanced desorption kinetics

At a total amine concentration of 2 mol/L, the MEA–PZ blend achieved a saturated CO₂ absorption capacity of 206.1 mL/L, with a desorption efficiency of 86.38%. These findings highlight the potential of mixed amine systems to outperform single-component solvents in industrial carbon capture applications.

To further optimize CO₂ capture performance, recent research has focused on composite alkanolamine systems—blends that combine the strengths of individual amines to improve overall absorption capacity, regeneration efficiency, and cycling performance. These mixed-solvent systems aim to balance fast kinetics, high capacity, and low energy consumption.

Key Findings from Recent Studies

  • MEA–MDEA–PZ Blends
    Zhang et al. [11] evaluated the energy efficiency of a mixed amine system consisting of MEA, MDEA, and PZ. Their results showed a 15.22% to 49.92% reduction in energy consumption for CO₂ capture compared to MEA alone.
  • MEA with Secondary and Tertiary Amines
    Zhang Yu et al. [12] compared the performance of MEA blended with DEA, TEA, and AMP under controlled conditions (99.5% CO₂, 40 °C water bath). Among the mixtures, MEA + AMP exhibited the best absorption performance, while MEA + TEA showed the weakest.
  • MEA + DETA Mixtures
    Wen Juan et al. [13] found that increasing temperature, pressure, and DETA concentration improved both the CO₂ absorption capacity and rate of the MEA + DETA system.
  • AMP, PZ, and MEA Blends
    NWAOHA et al. [14] observed that mixed systems containing AMP, PZ, and MEA demonstrated higher cycling capacity and initial desorption rates than MEA alone.
  • Amine + Activator Systems
    Zhang Xinjun et al. [15] tested six combinations of alkanolamines (MEA, DEA, TEA) and activators (PZ, N-methylpiperazine [N-MPP], and aminoethylpiperazine [AEP]). The best performance was achieved using MEA as the main absorbent and AEP as the activator.
  • AMP-Based Blends with MEA and AEP
    Xiao Kunru et al. [16] studied the impact of mixing AMP with MEA or AEP. Under conditions of 25 °C and 101 kPa:

    • A 5:5 AMP:MEA ratio yielded the best absorption results
    • A 7:3 AMP:AEP ratio showed faster desorption
    • While the AMP:MEA blend had a 2.558% higher absorption capacity and 1.587% faster absorption rate, its desorption rate was 18.52% lower than AMP:AEP

These studies demonstrate that composite amine systems can significantly improve CO₂ capture by combining complementary properties—such as fast kinetics, high loading capacity, and reduced regeneration energy. Mixed alkanolamine formulations represent a promising path forward in the design of next-generation absorbents for industrial-scale carbon capture.

In addition to modifying amine formulations through blending, recent research has explored the use of catalysts and nanoparticles to further enhance CO₂ absorption performance, improve regeneration efficiency, and reduce overall energy consumption.

Catalyst-Enhanced Amine Systems

Ali Saleh Bairq et al. [17] reported that incorporating SO₄²⁻/ZrO₂/SiO₂ into monoethanolamine (MEA) resulted in significant improvements:

  • 36.48% reduction in regeneration energy consumption
  • 35.1% increase in desorption rate

These results highlight the potential of heterogeneous acid-base catalysts to promote the reversibility of CO₂ absorption reactions in amine systems.

Nanoparticle-Modified Absorbents

Nanoparticles have also emerged as effective additives, enhancing mass transfer, absorption rate, and desorption efficiency. Li Wenya et al. [18] studied the impact of TiO₂ and graphene oxide (GO) nanoparticles on diethylaminoethanol (DEEA) and N-methyldiethanolamine (MDEA) systems.

Key results compared to MEA without nanoparticles include:

System Absorption Capacity Absorption Rate Desorption Capacity
30% DEEA + 0.05% 25 nm TiO₂
9.86% 33.43% 10.72%
30% MDEA + 0.05% 40 nm TiO₂ 11.26% 49.72% 9.19%
30% MDEA + 0.06% GO 13.8% 39.23% 26.66%

These nano-enhanced solvents demonstrated significant improvements in both absorption and regeneration metrics, offering a path to more efficient CO₂ capture processes.

Effect of Nanoparticle Size

Jiang et al. [19] compared the performance of 10 nm and 20 nm TiO₂ nanoparticles in MEA systems. While smaller particles offer higher surface activity, they are more prone to agglomeration, which can reduce effectiveness. In contrast, larger particles (20 nm) were found to more effectively disturb the mass transfer boundary layer, enhancing local mixing, concentration gradients, and overall mass transfer performance.

Incorporating catalysts or engineered nanoparticles into alkanolamine solutions is a promising direction for improving the kinetics, capacity, and energy efficiency of CO₂ capture systems. These additive-based approaches represent a valuable area of future research for next-generation absorbents.

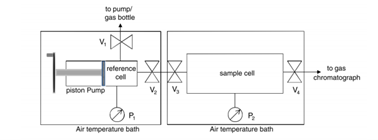
3.0 Experimental Method

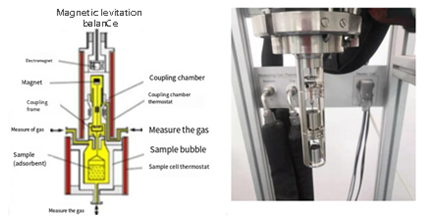
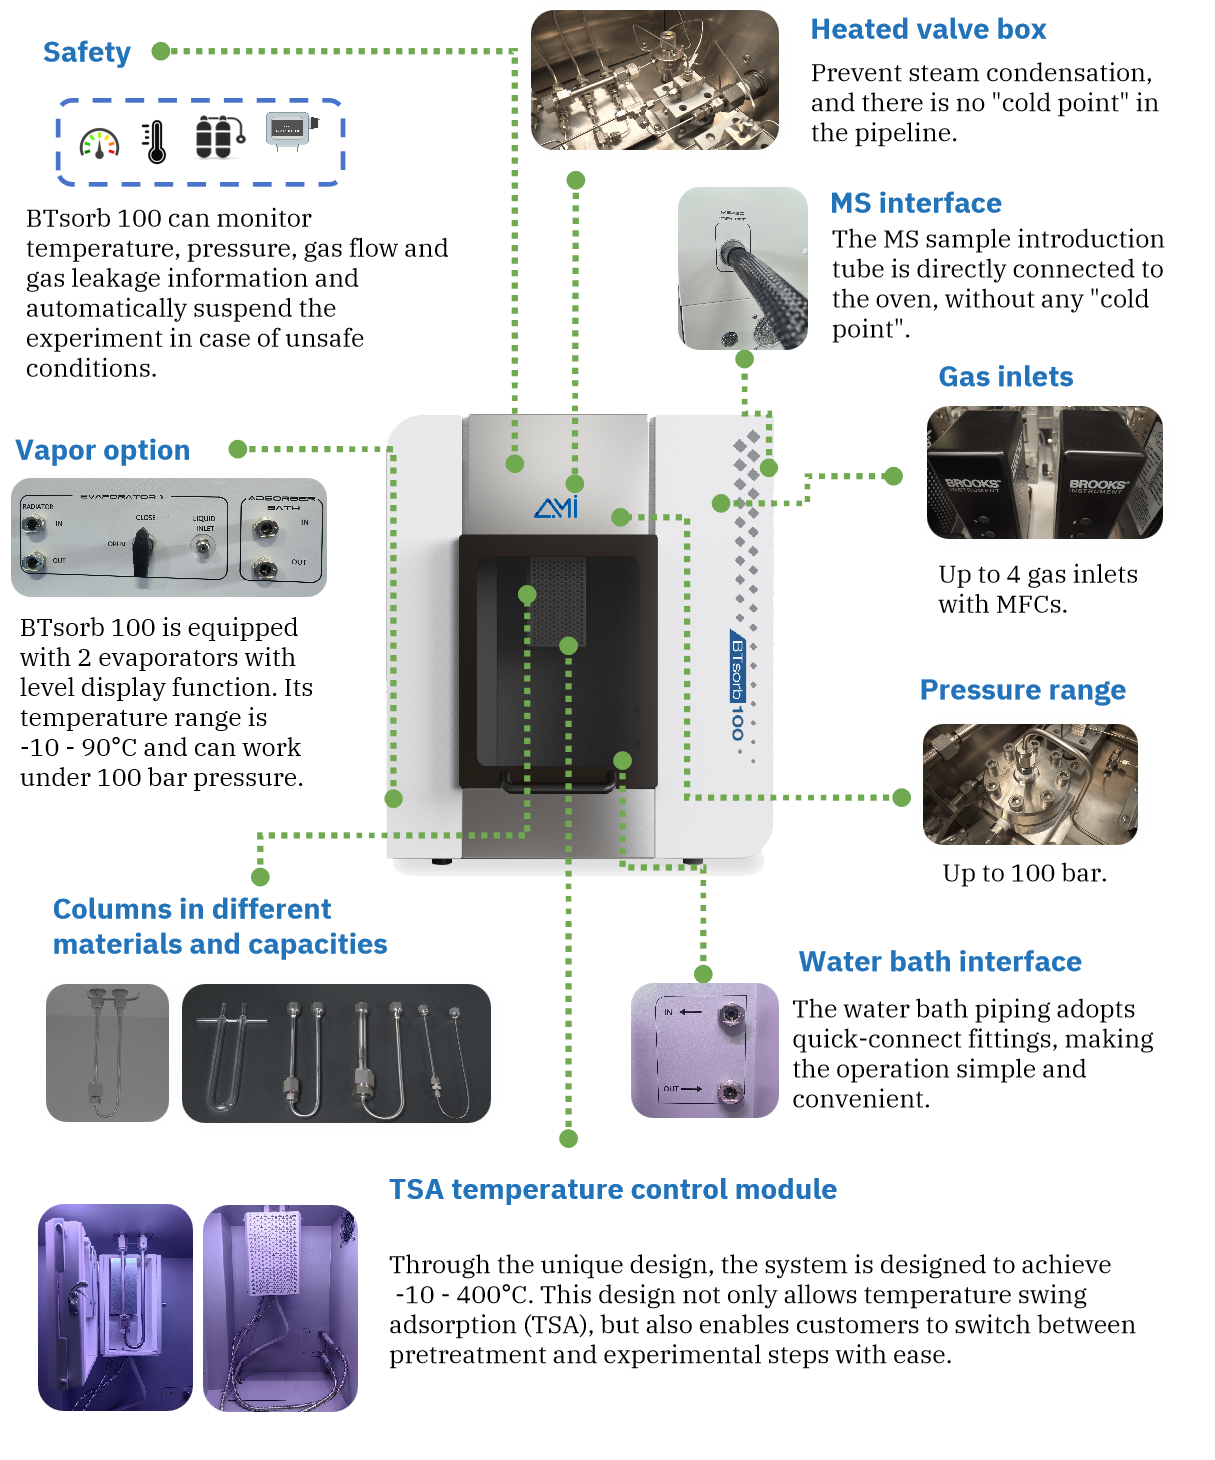
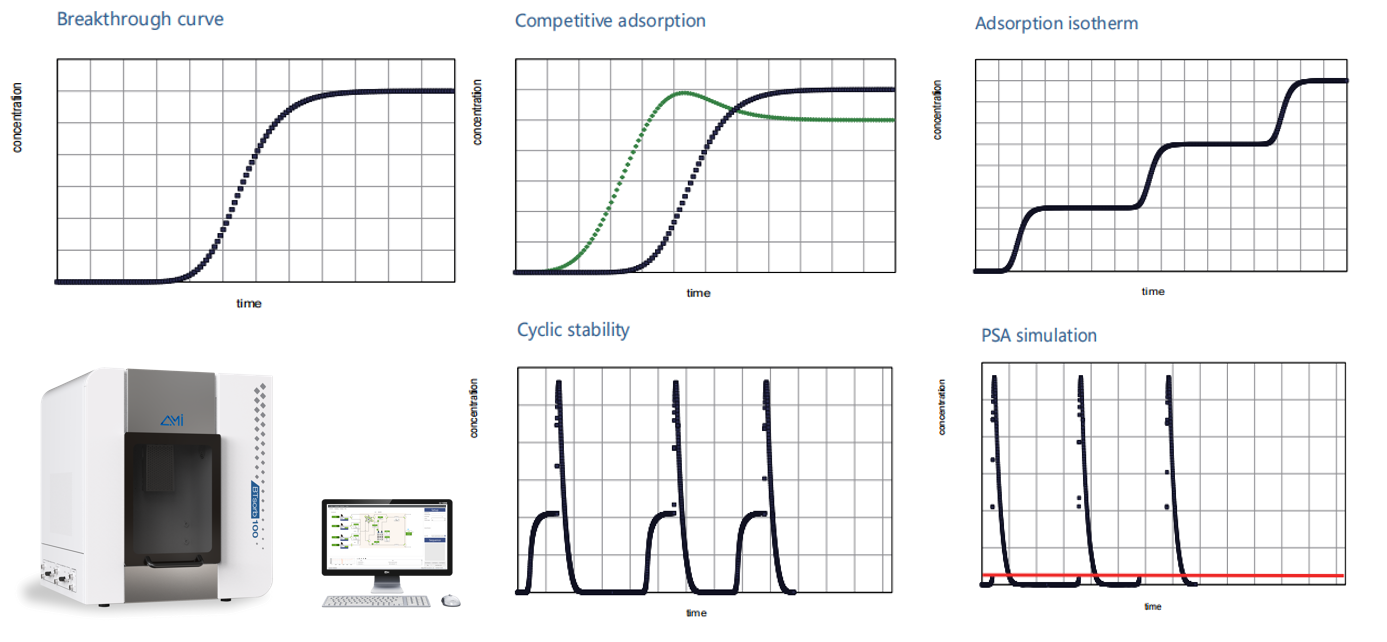
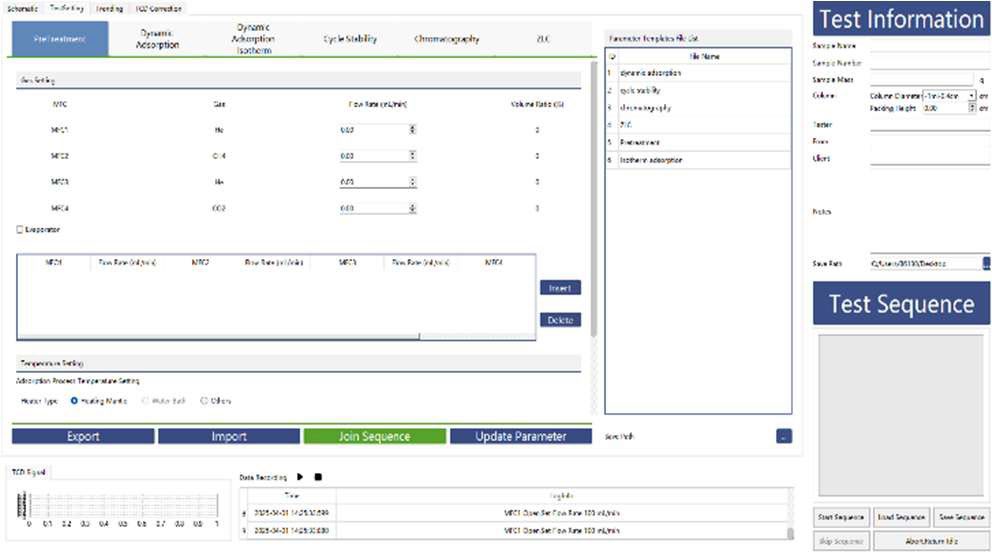
To study the CO₂ adsorption behavior of monoethanolamine (MEA), we conducted a series of experiments using the BTSorb 100 (formally MIX100) breakthrough curve and mass transfer analyzer on a commercially available MEA solution.

Test Procedure

  1. Sample Preparation:
    10 mL of MEA solution was measured for testing. Repeatability was verified through multiple runs.
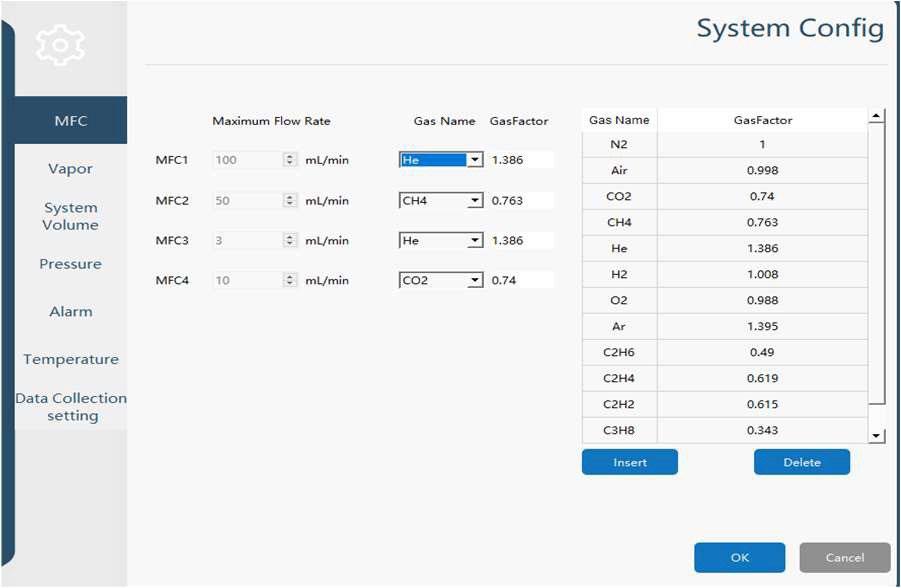
  2. Gas Flow Setup:
    • Adsorbate gas: CO₂ at a flow rate of 15 mL/min
    • Carrier gas: N₂ at a flow rate of 185 mL/min
  3. Temperature Control:
    The test was performed at a constant temperature of 40 °C. To eliminate interference from MEA vapor during measurement:

    • A condenser was installed at the outlet of the sample cell and maintained at 0 °C
    • A desiccant was placed in the cold trap to remove residual moisture from the gas stream

Experimental Conditions - Details of the test setup are summarized in Table 1 below.

Table 1 Experimental Conditions for Ethanolamine


Sample Volume (ml) N₂ Flow Rate (ml/min) CO₂ Flow Rate (ml/min) Temperature (°C) Pressure (bar)
10-1 185 15 40 1
10-1 (Re-adsorption) 185 15 40 1
10-2 185 15 40 1


  • 10-1 (Re-adsorption):
    This test refers to a repeated CO₂ adsorption experiment performed after desorption. Regeneration was carried out by heating the sample cell to 120 °C. Once the CO₂ concentration at the outlet dropped below 0.5%, the adsorption process was repeated under the same conditions.
  • 10-2 (Re-sampling):
    Represents an additional test performed by sampling fresh MEA solution under the same test conditions to assess repeatability.
  • System Preparation:
    Prior to each experiment, the system was purged with nitrogen (N₂) at 185 mL/min to ensure complete removal of residual CO₂ from the setup.

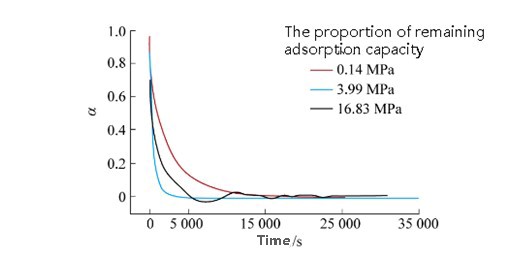
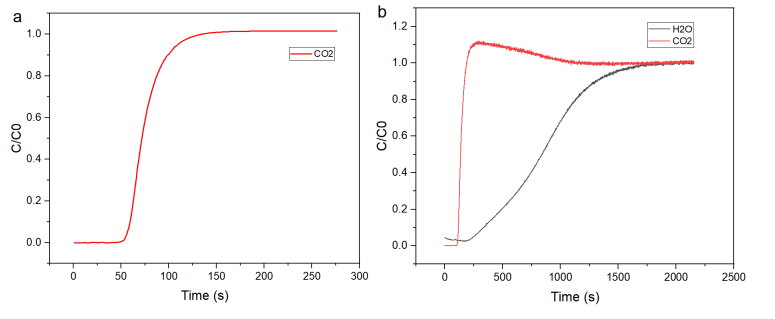
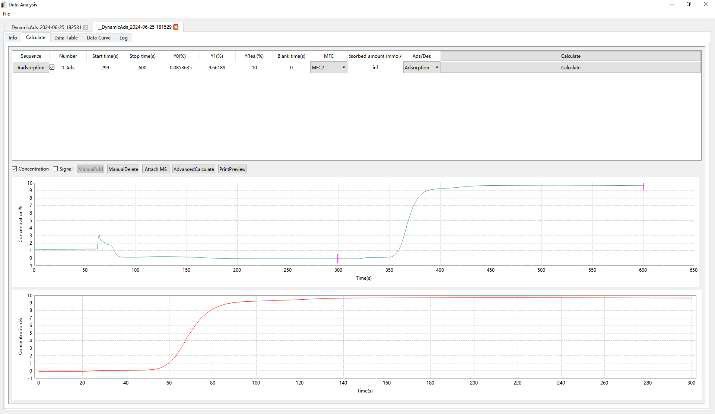
As shown in Figure 2, the breakthrough curves from the 10-1 and 10-2 tests are nearly identical, demonstrating excellent repeatability of the experimental setup. However, the 10-1 (re-adsorption) curve exhibits a slightly shorter breakthrough time, indicating a marginal decrease in adsorption capacity following the regeneration cycle.

This result suggests that while MEA retains good performance after regeneration, some loss of adsorption efficiency may occur, likely due to incomplete solvent recovery or minor thermal degradation during the desorption process.

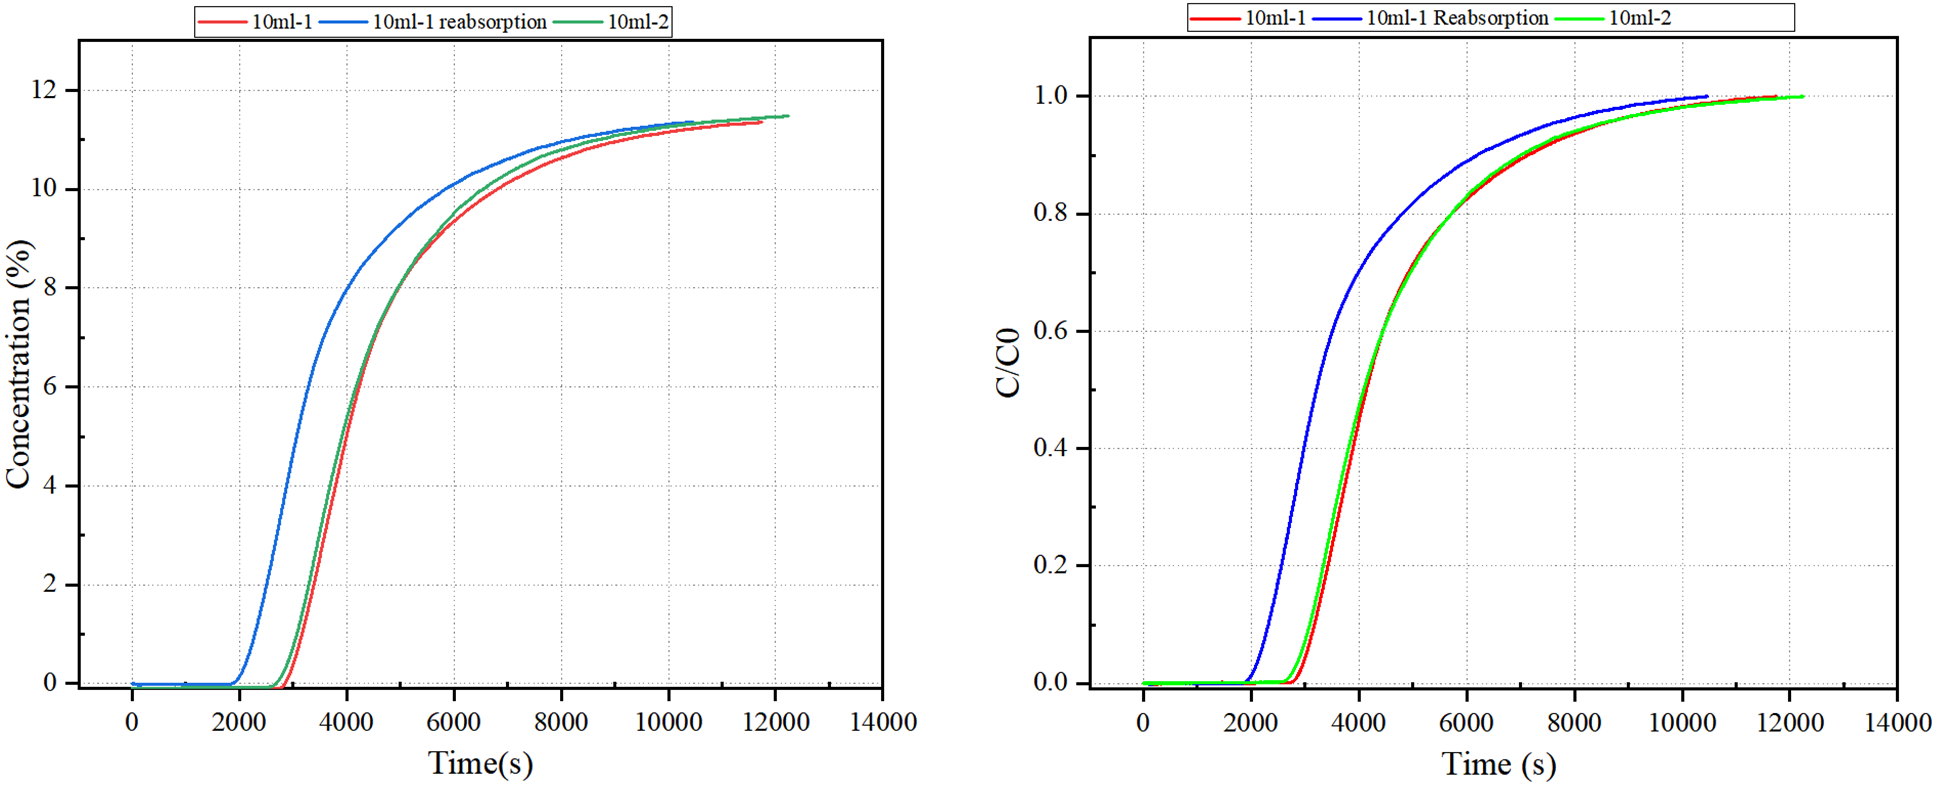
Figure 2 Breakthrough Curve of Ethanolamine MEA

Based on the calculated results presented in Table 2, the measured CO₂ adsorption capacities for the two 10 mL monoethanolamine (MEA) samples were 0.4875 mol/mol and 0.4822 mol/mol, respectively. These values are consistent with the commonly reported commercial MEA capacity of approximately 0.5 mol CO₂ per mol amine, validating the reliability of the test conditions and measurement approach.

Following desorption and re-adsorption (Test 10-1), the measured adsorption capacity decreased to 0.3875 mol/mol, indicating a notable decline in performance after regeneration. This reduction may be attributed to partial thermal degradation of MEA or incomplete recovery of active absorption sites during the desorption cycle.

Table 2 Calculated Adsorption Capacity Results for Ethanolamine MEA

Sample Name Adsorption Capacity mol(CO₂)/mol(MEA)
10ml-1 0.4875
10ml-1 (Re-adsorption 0.3875
10ml-2 0.4822

4.0 Conclusions

This study demonstrates the viability of using monoethanolamine (MEA) as a chemical absorbent for CO₂ capture under ambient conditions. Through a combination of theoretical review and experimental validation using the BTSorb 100 (formally MIX100) breakthrough analyzer, MEA was shown to achieve CO₂ adsorption capacities consistent with commercial expectations (~0.5 mol/mol). While regeneration was successful, a decline in adsorption performance after the desorption cycle suggests some loss in efficiency, likely due to thermal degradation or incomplete solvent recovery.

The data confirms that MEA remains a strong candidate for CO₂ absorption systems, especially when optimized with temperature control and proper regeneration protocols. Future improvements may be achieved through blending with secondary or tertiary amines, use of corrosion inhibitors, or incorporation of nanomaterials and catalysts to reduce energy consumption and enhance cycling performance. These directions represent promising opportunities for scaling liquid-phase CO₂ capture in industrial applications.

5.0 References

[1] Wang J., Huang L., Yang R., et al. Recent advances in solid sorbents for CO₂ capture and new development trends. Energy & Environmental Science, 2014, 7: 3478–3518.

[2] Venna S.R., Carreon M.A. Highly permeable zeolite imidazolate framework-8 membranes for CO₂/CH₄ separation. Journal of the American Chemical Society, 2010, 132(1): 76–78.

[3] Huang Yuhui. Research on the Degradation of Mixed Amine Absorbents for Flue Gas CO₂ Chemical Absorption Technology [D]. Hangzhou: Zhejiang University, 2021.

[4] Wang Dong, et al. Research progress on solid and liquid adsorbents for carbon dioxide capture.

Catalyst Performance Characterization Solution

Download PDF

Research Background

Heterogeneous catalytic processes are extremely complex surface physicochemical processes. The main participants in these processes are catalysts and reactant molecules, primarily involving the cyclic repetition of elementary steps, including diffusion, chemical adsorption, surface reaction, desorption, and reverse diffusion. The most critical steps are adsorption and surface reaction.

Therefore, to elucidate the intrinsic role of a catalyst in a catalytic process and the interaction mechanism between reactant molecules and the catalyst, it is necessary to investigate the catalyst's intrinsic structure (e.g., specific surface area and pore structure), adsorption properties (e.g., structure of adsorption centers, energy state distribution, adsorption states of molecules on adsorption centers), and catalytic properties (e.g., nature of active catalytic sites, metal dispersion). Further studies should also include mass transfer processes, reaction mechanisms, long-term stability, and pilot-scale evaluation to comprehensively assess catalyst effectiveness.


Solutions


2.1 Pore Structure

Heterogeneous catalytic reactions occur on the surface of solid catalysts. To maximize reaction activity per unit volume or weight, most catalysts are designed with porous structures to increase surface area. The porous structure and pore size distribution directly influence diffusion and mass transfer, which in turn affect catalytic activity and selectivity.


Zeolite catalysts are a class of microporous crystalline materials with uniform pore structures and extremely high surface areas. Figure 1 demonstrates nitrogen adsorption-desorption curves. In the low-pressure region, nitrogen adsorption sharply increases due to micropore filling. The HK pore size distribution reveals the most probable diameter is 0.57 nm, and the BET surface area is calculated as 675 m²/g.

FIGURE 1: Zeolite N₂ Adsorption-Desorption Isotherms (A) Linear Scale, (B) Logarithmic Scale, (C) HK Micropore Size Distribution

ctivated alumina is another widely used catalyst support. It shows excellent surface acidity and thermal stability. Figure 2 shows adsorption curves of two alumina samples with surface areas of 192.32 m²/g and 210.81 m²/g. BJH analysis indicates pore size peaks at 3 nm and 21 nm.

Nickel-loaded cerium dioxide (CeO₂) catalysts are notable for their redox cycling and oxygen storage. Figure 3 shows how increasing Ni loading reduces surface area (from 15.25 to 7.59 m²/g) and pore volume, due to Ni occupying surface sites.

FIGURE 3: (a) Ni@CeO N Adsorption-Desorption Isotherms, (b) BJH Pore Size Distribution


2.2 Active Centers

The intrinsic active sites of catalysts are key to their reactivity. These are best characterized dynamically under operating conditions. AMI systems apply temperature-programmed techniques (TPx series) for this purpose.


Temperature-Programmed Reduction (TPR)


TPR measures reducibility and interactions of active metal oxides with supports. Figure 4(a) shows a metal-supported alumina catalyst with a single strong reduction peak at 234°C and hydrogen consumption of 9680 µmol/g. Figure 4(b) shows three distinct peaks for Mn₂O₃ → Mn₃O₄ → MnO → Mn transformations. Figure 4(c) compares different Ni loadings on CeO₂, showing increasing reduction temperatures and decreasing hydrogen consumption as Ni loading increases.

FIGURE 4: H₂-TPR (a) Alumina-supported Catalyst, (b) Mn₂O₃-based Catalyst, (c) Ni@CeO₂ Catalyst Temperature-Programmed Oxidation (TPO)

TPO is used to evaluate coke deposition and regeneration conditions. Figure 5 shows TPO data for a Cr₂O₃ catalyst after reaction, with three peaks at 500°C, 578°C, and 631°C. The high-temperature coke species dominate, indicating a need for high-temperature regeneration.

Conclusion

Comprehensive catalyst characterization requires more than surface-level insight. From understanding pore architecture to quantifying redox behavior and coke formation, each technique provides a piece of the puzzle.


The integration of N₂ physisorption, TPR/TPO/TPSR, and pulsed chemisorption is essential for evaluating both performance and durability under realistic reaction conditions.


AMI’s chemisorption and physisorption instrument platforms enable researchers to conduct these analyses with precision and flexibility, combining automated gas handling, programmable thermal profiles, and real-time detection in a unified workflow.


Whether developing next-generation catalysts or optimizing industrial formulations, AMI provides the tools needed to accelerate R&D and ensure reliable, reproducible results.


With proven solutions for academia, government labs, and industry, AMI continues to support catalyst development from lab-scale discovery to pilot-scale deployment.

The Effect of Water Vapor on the Adsorption Performance of Solid Adsorbents

Download PDF

Introduction

In many industrial gas separation processes, the presence of water vapor presents a major challenge. Whether in exhaust gas treatment or coalbed methane (CBM) recovery, moisture in the gas stream can severely degrade the performance of solid adsorbents. During CBM extraction, significant amounts of methane are mixed with air, forming low-concentration mixtures—over 70% of which are typically released directly into the atmosphere. Effective methane/nitrogen separation from these dilute streams offers both environmental and economic advantages.


However, water vapor often interferes with this separation, particularly in materials such as metal-organic frameworks (MOFs). These materials are known for their high affinity to water, which competes with target gases for active sites and can destabilize the framework structure. Understanding this competitive behavior is critical to optimizing performance—especially when selecting adsorbents for use in real-world environments.


MOFs in Humid Methane/Nitrogen Mixtures

To assess the impact of moisture on separation performance, tests were conducted on DMOF and DMOF-TM using a 50/50 CH₄/N₂ mixture under controlled relative humidity conditions.

FIGURE 1: Permeation curves for CH₄/N₂ (50/50) at 298 K and 1 bar for (a) DMOF and (b) DMOF-TM at 20% and 40% RH


At 20% RH, both materials performed similarly to dry conditions. However, at 40% RH, DMOF failed to recover high-purity methane, while DMOF-TM exhibited earlier breakthrough and reduced selectivity. The decline is attributed to water’s competitive adsorption, which disrupts methane/nitrogen separation【1】.

With its ability to simulate real environmental humidity, AMI's BTSorb™ breakthrough system plays a vital role in quantifying this performance loss under humid conditions—enabling material screening that mirrors operational realities.


VOC Adsorption with Hydrophobic MOFs

Moisture also interferes with VOC removal. Hydrophobically modified UiO-66-NDC(50) shows decreasing toluene capacity with rising RH, from 143 mg/g at 0% RH to just 50 mg/g at 80%.

FIGURE 2: (a) Toluene adsorption capacity vs. humidity; (b)–(c) breakthrough curves for UiO-66-NDC(50)


Despite the presence of nonpolar functional groups, water molecules still dominate the adsorption landscape at high humidity. The ability to rapidly screen such performance drop-offs using AMI's modular vapor-generation capabilities gives researchers clear insight into material suitability【2】.


Ethylene Purification in Humid Gas Streams

In ethylene production, residual CO₂ and C₂H₂ must be removed to ultra-trace levels. Zeolite ETA-MOR is one candidate, but its performance suffers in humid conditions. However, after organic amine modification, ETA-MOR-0.5 maintains over 85% separation efficiency at 75% RH.


Figure 3: Permeation Curves for ETA-MOR Zeolite Molecular Sieve at 298 K (flow rate 5 ml/min); (a,b) Permeation Curves for ETA-MOR Zeolite in CO2/C2H2/C2H4 (1/1/98, v/v/v) Atmosphere under Dry and 75% RH Conditions; (c) Permeation Curve for ETA-MOR Zeolite in C2H2/C2H4 (1/1/99, v/v/v) Atmosphere; (d, e) Cycle Stability of ETA-MOR Zeolite in CO2/C2H4/C2H4 (1/1/98, v/v/v) Atmosphere under Dry and 75% RH Conditions; (f) Permeation Curves for Modified and Unmodified ETA-MOR at Different Humidities.


The amine modification alters the acid-base environment of the pores, enhancing hydrophobicity and reducing diffusion channels. AMI systems allowed for direct comparison of modified vs. unmodified materials across variable humidity conditions, helping pinpoint materials capable of high-selectivity operation under moisture stress【3】.


CO₂ Capture from Flue Gas with Humidity

Post-combustion CO₂ capture from flue gas—typically containing nitrogen, CO₂, and water vapor—is another key application where adsorbent performance must be tested under realistic humidity. While materials like NaX and EFS-10 degrade under moist conditions, functionalized sorbents such as EDA-Y and PEI/SiO₂ maintain strong performance due to the presence of amine groups that preferentially bind CO₂.


Figure 4: (a) TSA Adsorption-desorption Curve for CO2 (adsorption: H2O/CO2/Ar/N2 (3/15/2/80, v/v/v/v) at 313K, Desorption CO2 100, v@403K); (b) TSA Adsorption-desorption Curve for CO2 (CO2/Ar/N2 (15/2/83, v/v/v) at 313K, Desorption CO2 100, v@403K); (c) Comparison of CO2 Adsorption Amount at 3% Humidity and Dry conditions.


These results, made possible through AMI’s controlled-vapor testing infrastructure, demonstrate the need for precise experimental setups when evaluating adsorbents for use in flue gas environments【4】【5】.


Experimental Methods

Permeation and breakthrough experiments were carried out using AMI’s BTSorb™ 100 system.

  • Sample: 0.35 g packed into a 1 mL column
  • Pre-treatment: He purge at 150°C for 1 hour
  • Detection: AMI-Master 400 mass spectrometer

Test Conditions:

  • Dry CO₂/N₂: 100 mL/min; 10% CO₂ / 90% N₂; 1 bar; 313 K
  • Humid CO₂/N₂ (RH 80%): 106.2 mL/min; 9.41% CO₂, 84.73% N₂, 5.86% H₂O; 1 bar; 313 K


With AMI’s advanced instrumentation, vapor content can be tightly regulated, enabling high-fidelity simulation of industrial scenarios.


Results and Discussion

Figure 5 (a) Breakthrough Curves of the Molecular Sieve under Dry CO2/N2 (10/90, v/v) Atmosphere;

(b) Breakthrough Curves of the Molecular Sieve under CO2/N2 (10/90, v/v) Atmosphere with 80% Relative Humidity (RH=80%).


Under dry conditions, the CO₂ adsorption capacity reached 1.71 mmol/g, with a standard breakthrough curve. Under 80% RH, the capacity dropped to just 0.528 mmol/g due to water displacing CO₂ at the active sites. This competitive behavior would be missed using dry-gas-only evaluations—further underscoring the importance of humidity simulation during testing.


Conclusion

Water vapor is a critical factor affecting adsorption performance in gas separations. Whether for methane, VOCs, ethylene purification, or CO₂ capture, competitive adsorption by water significantly alters the effectiveness of many adsorbents.

AMI systems—equipped with integrated steam generators, configurable gas mixers, and real-time mass spec analysis—enable researchers and process engineers to test under realistic, application-specific conditions. This ensures more reliable data, better materials selection, and ultimately, more efficient gas separation processes.


References

[1] Li Tong. Study on Efficient Separation of Methane/Nitrogen under Humid Conditions Using DMOF Materials. Taiyuan University of Technology, 2022.
[2] Li Wenxiang. Hydrophobic Modification of MOFs (UiO-66) and VOC Adsorption Performance under Humidity. Shandong University, 2022.
[3] Shi X., Zhang B., Chen H. Organic Molecular Gate in Mordenite for Deep Removal of C₂H₂ and CO₂ from Ethylene. Sep. Purif. Technol., 2023.
[4] Mu J., Fang Z., Zhu H. Solid Adsorbents for CO₂ Capture in Flue Gas. Fine Chemicals, 2023, 40(9): 1857–1865.
[5] Cho H., Choi M., Sung S., et al. EDA-Grafted Y Zeolite: Regenerable CO₂ Adsorbent via TSA without Urea Formation. Energy Environ. Sci., 2016, 9(5): 1803–1811.


Adsorption Applications of Electronic Specialty Gases

Download PDF

1. Introduction

Electronic specialty gases are essential foundational materials in modern electronics manufacturing—often referred to as the "blood" or "food" of the industry. These high-purity gases are critical to the production of semiconductors, display panels, LEDs, and photovoltaics. In 2021, the demand from these sectors accounted for 43%, 21%, 13%, and 6% of total consumption, respectively [1].

The purity requirements for electronic specialty gases are stringent, typically at the 5N (99.999%) level, with some applications demanding 6N (99.9999%) or even higher. Gas purity and quality directly influence device yield and performance, making both synthesis and purification technologies central to specialty gas production. Common synthesis methods include electrolysis, chemical reactions, and combined electrochemical approaches, while purification techniques span adsorption, distillation, absorption, and membrane separation [1].

Semiconductor manufacturing, comprising thousands of highly specialized steps, relies on over 100 types of specialty gases—44 of which are commonly used. These include compounds such as trifluorine nitride, tetrafluorocarbon, and sulfur hexafluoride, typically supplied in liquid or pressurized gas form.

Each major semiconductor process uses specialty gases for critical roles:

  • Cleaning: Removes contaminants from wafers and surfaces using gases such as SF₆ and CF₄.
  • Coating (CVD/ALD): Deposits films through gas-phase reactions using precursors like tungsten hexafluoride, silane, ammonia, and nitrous oxide.
  • Lithography: Involves plasma formation from mixed gases (e.g., Ar/F/Ne, Kr/Ne) to generate stable, high-precision light sources for photomask patterning.
  • Etching: Selectively removes material using fluorocarbons such as CH₃F, CH₂F₂, CF₃H, and halogen gases like Cl₂ and HBr to define intricate microstructures.
  • Doping: Introduces conductivity to semiconductors using gases like arsine, phosphine, diborane, and trifluoroborane [2].

These processes demand precise control and validation of gas delivery, purity, and usage conditions—making gas analysis, gravimetric sorption, and breakthrough testing indispensable tools in quality assurance and process development.

The adsorption method leverages the principle that porous materials exhibit selective gas uptake depending on the molecular properties of the gas and the characteristics of the material. For a given porous adsorbent, different gases exhibit different adsorption capacities. When a gas mixture is passed through an adsorbent bed, gases with stronger affinities to the surface will be preferentially adsorbed, while those with weaker interactions will exit the system—achieving a separation effect. The adsorbed gas can subsequently be desorbed by thermal regeneration or gas purging, allowing for recovery of purified components [1].

One prominent application of this technique is the separation of xenon (Xe) and krypton (Kr)—a challenging and high-value target for gas purification. Xe and Kr are critical to industries such as semiconductors, medical imaging, aerospace, and lighting.

Wang et al. developed a negatively charged coordination ultramicroporous material, NbOFFIVE-2-Cu-i (ZU-62), that demonstrated a breakthrough in Xe/Kr separation performance [3]. ZU-62 features a finely tunable pore size and flexible framework, resulting in a unique inverse size sieving effect—a rare case where the larger atom (Xe) is selectively adsorbed over the smaller atom (Kr). As shown in FIGURE 1, static adsorption isotherms confirm high Xe uptake and preferential exclusion of Kr due to the material’s precise pore chemistry and geometry.

To validate the material's real-world separation efficiency, dynamic breakthrough experiments were performed at 273 K (FIGURE 2). Kr eluted early, while Xe showed delayed breakthrough—demonstrating strong selective adsorption of Xe. The system achieved production of >99.9% pure krypton from the effluent stream and record Xe capture of 206 mL/g (2.88 mmol/g), aligning well with isotherm data and confirming the industrial relevance of the material [3].

Figure 1 Adsorption and desorption isotherms of pure components of Xe and Kr by ZU-62 at 273 K and 298 K

Figure 2 (A) Pore penetration experiment of Xe/Kr (20/80) mixture at 273 K and 1 bar conditions; (B) Desorption signals of Xe and Kr during regeneration process at 298 K with a flow rate of 3.5 mL/min-1 of N2, the green curve represents the real-time cumulative purity of Xe.

2. Experiment

Sample Selection and Objective

Two metal-organic framework (MOF) materials were selected for adsorption and gas separation studies:

  • MOF-1: Targeted for SF₆/N₂ adsorption and separation
  • MOF-2: Targeted for Xe/Kr adsorption and separation

Both dynamic breakthrough experiments and static isotherm measurements were performed to evaluate the adsorption capacity and selectivity of each material under relevant conditions.

Dynamic Breakthrough Testing

Competitive adsorption experiments were performed using the BTSorb-100 Breakthrough Curve and Mass Transfer Analyzer from AMI. A 1 mL stainless steel adsorption column (inner diameter: 0.45 cm; bed height: 5 cm) was used for all tests.

  • SF₆/N₂ separation (MOF-1):
  • Temperature: 298 K
  • Pressure: 2 bar
  • Total flow: 30 mL/min
    • Composition: 13.5 mL/min N₂, 1.5 mL/min SF₆, 15 mL/min He (carrier)
  • Xe/Kr separation (MOF-2):
  • Temperature: 25°C
  • Pressure: 1 bar
  • Total flow: 3 mL/min
    • Composition: 0.6 mL/min Xe, 2.4 mL/min Kr

Breakthrough curves were recorded and used to assess gas retention times, separation resolution, and dynamic capacity for each system.

Static Adsorption Testing

Static adsorption isotherms were measured using the AMI Sync 400 Surface Area and Pore Size Analyzer. For both MOFs:

  • Sample mass: 0.12 g
  • Pretreatment: Vacuum degassing at 120°C for 12 hours
  • Measurement conditions:
  • SF₆/N₂ isotherms at 273 K (MOF-1)
  • Xe/Kr isotherms at 298 K (MOF-2)

The resulting data enabled comparison between static adsorption capacity and dynamic performance, offering insight into material structure-performance relationships.

3.Results and Discussion

Perfluorinated electronic specialty gases—including NF₃, CF₄, and SF₆—play a critical role in the fabrication of silicon-based semiconductors due to the strong chemical reactivity between fluorine and silicon. However, the conversion efficiency of F-gases in plasma processes is often below 60%, leaving unreacted F-gases and byproducts such as N₂, NOₓ, HF, and H₂O in the exhaust stream. As environmental regulations tighten and gas recovery becomes increasingly important, adsorbent-based purification has emerged as a key area of research and development.

To assess adsorption-based purification of SF₆, MOF-1 was tested for its separation capability in an SF₆/N₂ gas mixture.


Static Adsorption Behavior

As shown in FIGURE 3(a), static adsorption isotherms indicate that MOF-1 exhibits a significantly higher adsorption capacity for SF₆ compared to N₂. This disparity suggests the potential for selective adsorption and separation of SF₆ from nitrogen under controlled conditions.

Dynamic Breakthrough Performance

To evaluate real-world separation behavior, a dynamic breakthrough experiment was conducted using the BTSorb-100 system. A 10:90 SF₆/N₂ gas mixture was introduced at 298 K, 2 bar, and a total flow rate of 30 mL/min.

As shown in FIGURE 3(b), the breakthrough curve illustrates clear separation behavior:

  • N₂ began to elute at approximately 50 seconds
  • SF₆ broke through at around 250 seconds
  • The resulting separation window was approximately 200 seconds, representing the effective retention time of SF₆ on MOF-1 under these conditions

Calculated dynamic adsorption capacities were:

  • N₂: 0.905 mmol/g
  • SF₆: 0.857 mmol/g

These results were consistent with the static isotherm values, where MOF-1 adsorbed 1.01 mmol/g of N₂ at 95 kPa and 0.896 mmol/g of SF₆ at 9.28 kPa.

The close agreement between static and dynamic data confirms the reliability and practical relevance of the measured separation behavior. Taken together, these findings demonstrate that MOF-1 offers viable adsorption and separation performance for SF₆/N₂ systems, and highlights its potential use in semiconductor exhaust gas purification processes.

Figure 3 (a) Adsorption isotherms of SF6 and N2 on MOF-1 at 298K; (b) Competitive adsorption breakthrough curve of MOF-1 at a temperature of 298K, a total pressure of 2 bar, and a total flow rate of 30 mL/min (He/N2/SF6 = 50/45/5).

Xenon (Xe) and krypton (Kr) are high-value noble gases, often referred to as "golden gases" due to their scarcity and wide-ranging industrial applications. Their unique physical and chemical properties make them essential in fields such as semiconductor manufacturing, lighting, aerospace, medical imaging, and anesthesia [4]. As a result, the efficient separation and purification of Xe from Kr remains a high-priority challenge in specialty gas processing.

In this study, MOF-2 was evaluated for its ability to adsorb and separate Xe/Kr mixtures.

Static Adsorption Isotherms

As shown in FIGURE 4(a), adsorption isotherms measured at 273 K demonstrate that MOF-2 exhibits a significantly higher adsorption capacity for Xe compared to Kr. When the temperature was increased to 298 K (FIGURE 4(b)), the adsorption capacities of both gases decreased—consistent with exothermic physisorption behavior—but Xe remained more strongly adsorbed than Kr, suggesting favorable selectivity across a range of operating conditions.

These static results confirmed MOF-2’s potential for selective Xe adsorption from a Xe/Kr mixture.

Dynamic Breakthrough Testing

To evaluate separation performance under flow conditions, a competitive dynamic breakthrough experiment was conducted using a 20/80 (v/v) Xe/Kr binary gas mixture. The test was carried out at 298 K, 1 bar, and a total flow rate of 3 mL/min.

As shown in FIGURE 4(c):

  • Kr broke through the adsorption column in under 500 seconds
  • Xe did not appear in the effluent stream until ~2500 seconds
  • The breakthrough time difference exceeded 2000 seconds, indicating a long and effective separation window

Calculated adsorption capacities were:

  • Xe: 1.5489 mmol/g (dynamic), 1.6749 mmol/g (static at 20 kPa)
  • Kr: 0.9542 mmol/g (dynamic), 1.025 mmol/g (static at 80 kPa)

The close agreement between static and dynamic data, along with the large differential in breakthrough times, confirms that MOF-2 offers strong selectivity and capacity for Xe over Kr. These results demonstrate MOF-2’s practical utility for Xe purification from Kr-containing gas mixtures, with potential applicability in industrial gas recovery and semiconductor process optimization.

Figure 4 (a) Adsorption isotherms of Xe and Kr by MOF-4 at 273K; (b) Adsorption isotherms of Xe and Kr by MOF-4 at 298K; (c) Dynamic competitive adsorption curves of Xe/Kr by MOF-4 under normal temperature and pressure, total flow rate of 3 mL/min (Xe/Kr 20/80)

4. Conclusion

The results of this study confirm that advanced MOF materials offer strong potential for the selective adsorption and separation of high-value electronic specialty gases, including SF₆/N₂ and Xe/Kr mixtures. The close correlation between static isotherm data and dynamic

breakthrough results underscores the importance of combining both measurement approaches for accurate performance evaluation.

Using Sync 400 surface area and pore size analyzer and the BTSorb-100 breakthrough system, researchers were able to characterize adsorption behavior with high resolution and repeatability under realistic process conditions. These tools provided critical insights into both capacity and selectivity, enabling a comprehensive understanding of material performance.

As demand continues to grow for high-purity gases in semiconductor, medical, and aerospace industries, precision gas separation technologies will remain a key innovation area. AMI’s application-driven instrumentation supports the development and scale-up of advanced materials by delivering robust, accessible, and high-performance analytical solutions.

5. References

[1] He, H., Liu, Y., Zhang, J., et al. Research Progress in Synthesis and Purification Technologies of Electronic Specialty Gases. Low Temperature and Specialty Gases, 2023, 41(01): 1–5+46.

[2] China's Electronic Specialty Gases: From Import Substitution to Global Supply — In-depth Report on the Electronic Specialty Gas Industry.

[3] Wang, Q., Ke, T., Yang, L., Zhang, Z., Cui, X., Bao, Z., Ren, Q., Yang, Q., Xing, H. Angewandte Chemie, 2020, 132(9): 3451–3456.

[4] Zhao, Z. Research on Enhanced Xe/Kr Selective Adsorption Separation by Regulating Adsorbent Pore Environment. Nanchang University, 2023. DOI: 10.27232/d.cnki.gnchu.2023.003407.


Selective Adsorption of Small Hydrocarbons Using MOFs

Download PDF

Abstract

This application note presents a study on the selective adsorption behavior of small molecule hydrocarbons—acetylene (C₂H₂), ethylene (C₂H₄), propane (C₃H₈), and propylene (C₃H₆)—on various metal-organic framework (MOF) materials. Using AMI’s Micro 300 for high-precision static adsorption isotherms, this work highlights the potential of MOFs in non-cryogenic, energy-efficient separation of light hydrocarbons. Although dynamic breakthrough testing was not performed in this study, AMI’s BTsorb 100 system is noted as an ideal platform for future validation under flow conditions.

Introduction

In the petrochemical industry, C₂ hydrocarbons are foundational to the production of downstream products including polymers, rubbers, and specialty chemicals. However, separating these components remains difficult due to their similar boiling points and molecular sizes. Conventional cryogenic distillation is energy-intensive and cost-prohibitive.

Recent studies have demonstrated that MOF materials—due to their tunable pore size and chemically functionalized internal surfaces—offer a promising solution for energy-efficient separation of these hydrocarbons. Examples include the SIFSIX series, known for acetylene/ethylene selectivity (FIGURE 1), and flexible frameworks like sql-SIFSIX-bpe-Zn, which undergo reversible transformations in the presence of C₂H₂ (FIGURE 2). Additionally, MIL-142A, a cross-linked Fe-MOF, has shown remarkable capacity and selectivity for C₃H₈ over CH₄ under ambient conditions (FIGURE 3).

Figure 1: (a) SIFSIX-1-Cu-4C2D2 Structural Diagram and (b-f) C₂H₂ Adsorption and C₂H₂/C₂H₄ Separation Schematic

Figure 2: (Left) Adsorption Changes of C₂H₂ during the SC-SC Transition of the two-dimensional Flexible MOF Material sql-SIFSIX-bpe-Zn; (Right) C₂H₂/C₂H₄ Separation Ratio.

Figure 3: C1/C2/C3 Three-component Gas Separation Diagram of MIL-142A

Experimental Methods

Instruments

  • AMI Micro 300: Used to collect static adsorption isotherms of gases on MOF samples at room temperature.
  • AMI BTsorb 100: Identified as the intended platform for future dynamic breakthrough testing of gas mixtures under flow conditions.

Conditions

  • Temperature: Ambient (~298 K)
  • Pressure Range: Up to 100 kPa
  • Gases Tested: C₂H₂, C₂H₄, C₃H₆, C₃H₈
  • MOF Samples: Labeled MOF-1, MOF-2, and MOF-3

Results and Discussion

C₂ Hydrocarbon Adsorption

Adsorption isotherms recorded on the AMI Micro 300 revealed a distinct difference in uptake behavior between acetylene and ethylene. For MOF-1, acetylene displayed a steep increase in adsorption between 4–6 kPa, followed by saturation (FIGURE 4). Ethylene, by contrast, showed negligible adsorption across the tested pressure range.

Figure 4: Adsorption Isotherm on Micro 300

These results are consistent with the known affinity of fluorinated MOFs for triple-bonded hydrocarbons, likely due to π-H interactions with exposed SiF₆²⁻ groups.

C₃ Hydrocarbon Selectivity

Further experiments evaluated the adsorption of propane and propylene on MOF-2 and MOF-3. Both materials exhibited strong uptake of propylene while showing no detectable adsorption of propane (FIGURE 5). The clear selectivity suggests that steric effects and kinetic diameter differences influence uptake behavior.

Figure 5: Adsorption Isotherm on Micro 300 of MOF 2 and 3

Note on Dynamic Testing

Although dynamic breakthrough testing was not conducted as part of this study, the AMI BTsorb 100 is designed for such evaluations and remains a valuable tool for future studies aimed at simulating industrial gas separation scenarios.


Applications

These findings indicate that:

  • MOF-1 is suited for trace acetylene removal from ethylene streams in polymer production.
  • MOF-2 and MOF-3 can selectively capture propylene, ideal for propylene recovery or purification from LPG mixtures.

By pairing AMI’s Micro 300 for equilibrium data and the BTsorb 100 for future dynamic testing, researchers can comprehensively assess adsorbent materials for industrial gas separation applications.


Conclusion

This study underscores the promise of MOF-based adsorbents for targeted separation of light hydrocarbons at ambient conditions. While this work focused on static adsorption behavior, AMI’s suite of instruments—especially the Micro 300 and BTsorb 100—provides a scalable, versatile platform for future full-cycle evaluation from material screening to process development.

BTsorb 100 Series

INTRODUCTION

  • The BTsorb 100 series is a new line of cost-effective material characterization instruments designed for breakthrough curve testing, competitive adsorption, and mass transfer kinetics analysis. It is a comprehensive, versatile, and precise dynamic sorption analyzer.
  • • Accurate: Trusted results you can rely on.
    • Accessible: Cost-effective without compromise.
    • Advanced: Engineered for high-performance.
  • BTsorb 100 Series Breakthrough Curve and Mass Transfer Analyzer
  • BTsorb 100 series

FEATURE

CAPABILITIES

  • The BTsorb 100 offers 5 modes for breakthrough curve and competitive adsorption analysis, enabling dynamic evaluation of gas or gas/vapor mixture separation. It also includes 2 dedicated modes for diffusion studies using chromatography and the zero-length column method.
  • 5 Modes for Breakthrough Curve & Competitive Adsorption:
  • 2 Modes for Diffusion Coefficients:

SOFTWARE

  • BTManager is a user-friendly software platform that enables precise control of all experimental processes, while automatically recording data and calculating test results. It offers a range of features designed to simplify and support user operation.
  • √ In addition to standard procedures, the software allows full customization of experimental steps to meet specific testing requirements.
    √ All experimental steps and data are automatically recorded, making it easy for users to review and analyze results.
    √ As part of a fully automated system, BTManager enables conditional controls based on time, temperature, pressure, and detector signals—ensuring precise execution, repeatability, and accuracy.
    √ Includes advanced features such as blank adsorption correction, true flow calibration, abnormal data detection, and TCD signal calibration—minimizing environmental and system influences for highly reliable results.
  • Control interface
  • Data analysis interface
  • Experimental parameter setting interface
  • System configuration interface

APPLICATION

  • The BTsorb 100 series is primarily used to evaluate the adsorption and separation properties of porous materials. Common samples include MOFs, zeolites, silica gels, activated carbons, and other functional adsorbents. These materials are widely applied in processes such as gas separation purification, and CO2 capture, The BTsorb 100 meets the broad range of dynamic sorption analysis needs for these applications.

SPECIFICATIONS

  • BTSorb 100 Series Breakthrough Curve and Mass Transfer Analyzer Breakthrough Curve Analyzer
    Model 100S Pro 100SLP Pro 100SMP Pro 100S 100SLP 100SMP 100SHP
    Breakthrough Curve
    Competitive Adsorption
    Adsorption Isotherm
    Cyclic Stability V V V V V V V
    Temperature Swing Adsorption
    Pressure Swing Adsorption / /
    Diffusion Coefficient / / / /
    Pressure Range Atmospheric Atm -10 bar Atm -40 bar Atmospheric Atm -10 bar Atm -40 bar Atm -100 bar
    MFCs 4 MFCs (1 carrier + 3 adsorbate)
    Gas Inlets Standard 4 ports(expandable with MGC-option)
    Vapor Dosing Up to 2 vapor generators(temperature control -10°C to 90°C)
    Temperature Control Standard:
    Heating module: Ambient - 400 °C; Circulating water bath: -10 - 90°C; Option: Heating furnace: Ambient -1000°C; (Continuous temperature control from -10°C to 400°C can be achieved through the combined use of heating module and circulating water bath)
    Standard:
    Heating module: Ambient - 400 °C; Option: Circulating water bath: -10 - 90°C; Heating furnace: Ambient - 1000°C; (Continuous temperature control from -10°C to 400°C can be achieved through the combined use of heating module and circulating water bath)
    Detector Standard: High precision Thermal Conductivity Detector (TCD)
    Option: Mass spectrometer (100amu - 200/300 amu optional)
    Column Standard: 1 ml and 4 ml 316SS
    Option:1ml and 4ml quartz; column for ZLC
    Corrosion Resistance Standard: Corrosion-resistant TCD
    Option: Sulfur-resistant corrosion protection gas path upgrade,
    passivation treatment of fittings and tubing is mainly used for sulfur - containing gases (such as H₂S) and scenarios with high - concentration of corrosive gases.
    Air Compressor Used to drive pneumatic valves (option)
    Appearance Parameters L 31.9 in (810 mm) × W 31.1 in (790 mm) × H 34.6 in (880 mm), 330 lbs (150 kg)