 Products
 Products
Advanced Measurement Instruments
 TEL: +1 262-877-3600
 EMAIL:sales@ami-instruments.com
Copyright © 2025 Advanced Measurement Instruments
Supported metal catalysts feature catalytically active metals dispersed across porous carriers such as alumina, activated carbon, or silica. These metals are typically present in a microcrystalline form, maximizing surface area and enhancing reactivity. However, in practice, only the surface-exposed metal atoms participate in catalytic reactions—atoms buried within the bulk structure remain inactive.
As a result, metal dispersion—the proportion of surface atoms relative to the total metal content—plays a pivotal role in catalytic performance. This is commonly quantified by IUPAC as:
Dispersion (%) = (Number of surface metal atoms / Total number of metal atoms) × 100
Highly dispersed catalysts offer enhanced activity, selectivity, and resistance to deactivation phenomena such as carbon deposition and sintering. Since many catalysts utilize precious metals, maximizing dispersion not only improves efficiency but also reduces material costs. Thus, accurately measuring dispersion is essential for both technical optimization and economic viability.
A variety of techniques are available to evaluate metal dispersion, broadly categorized into physical and chemical methods [1]. Physical techniques such as X-ray Diffraction (XRD), X-ray Photoelectron Spectroscopy (XPS), and Transmission Electron Microscopy (TEM) estimate dispersion indirectly by assessing crystallite size or surface composition. However, these approaches often require complex modeling and may struggle with heterogeneous or amorphous samples.
In contrast, chemical adsorption methods—such as pulse chemisorption and static chemisorption—offer a more direct measurement by quantifying the amount of probe gas that binds to active metal sites.
These techniques are especially valuable for characterizing the reactive surface area most relevant to catalytic behavior [2].
Chemisorption can also provide insights into crystallite size, active surface area, and the relative contributions of reversible and irreversible adsorption. Despite its power, the static method has some limitations: high-vacuum requirements, longer analysis times for multi-point isotherms, and potential errors from effects like hydrogen spillover [3] or strong metal–support interactions that block access to reactive sites [4].
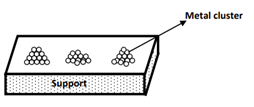
Figure 1: Representation of metal sites on a support
Dynamic chemisorption—commonly known as pulse chemisorption—is a widely used technique for measuring the surface-active metal sites in supported catalysts. In this method, reactive gas molecules selectively adsorb onto exposed metal atoms, without interacting with the carrier support.
The experiment is performed under isothermal conditions, typically at ambient temperature and atmospheric pressure. A calibrated sample loop injects fixed volumes of reactive gas into a flowing carrier gas stream. As the gas mixture passes over the catalyst bed, the reactive species adsorb onto available metal sites—often through associative adsorption—while unadsorbed gas continues downstream to a detector, such as a thermal conductivity detector (TCD).
Successive gas pulses are introduced until the catalyst surface becomes saturated and no further adsorption occurs. This saturation behavior, reflected in the detector signal, allows precise quantification of the adsorbed gas and thus enables accurate calculation of metal dispersion and active surface area.
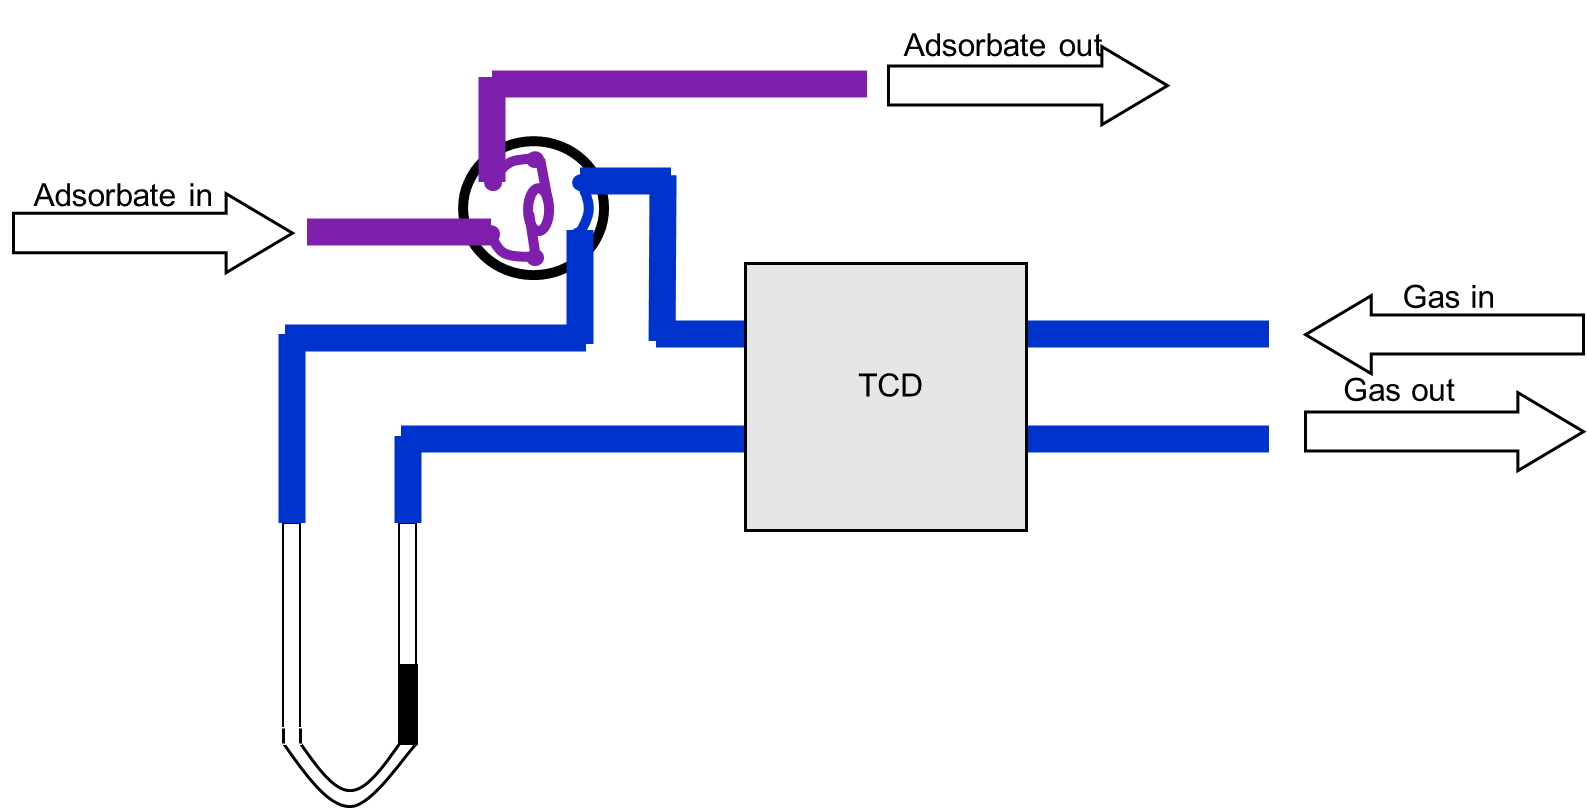
Figure 2: Pulse Chemisorption Instrumentation
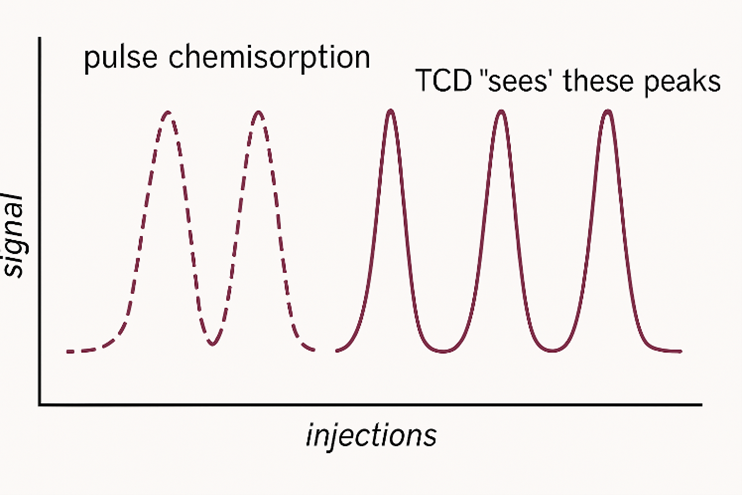
Figure 3: “Missing Peaks” representation of the TCD signal
In pulse chemisorption, the adsorption quantity is the key parameter for quantitative analysis. It represents the amount of reactive gas adsorbed per unit mass of catalyst, typically expressed in µmol/g. This value is conceptually aligned with physical adsorption but derived through chemical interaction between the adsorbate and active metal sites.
During the experiment, a fixed volume of reactive gas is repeatedly pulsed into a flowing carrier gas stream through a calibrated sample loop. As the gas passes over the catalyst bed, it interacts with exposed metal sites, while unadsorbed gas is carried to a thermal conductivity detector (TCD), generating a series of pulse peaks (Figure 3).
As the surface nears saturation, gas uptake decreases and the detector signal stabilizes. The final peak, corresponding to complete saturation, serves as the baseline for calculating gas uptake in earlier pulses.
Quantification of adsorption is based on comparing the area of each unsaturated pulse to the average area of saturated peaks. Two primary calculations are used:
Quantitative Correction Value (Cv):
Cv = (V_loop × C_gas) / (ΣA_sat / n_sat)
Where:
Sample Adsorption Amount (Uptake):
Uptake = Cv × Σ(A_i - A_sat-avg)
Where:
The calculated adsorption quantity forms the basis for further analysis of catalyst structure, including:
Required known values:
The stoichiometric factor reflects the number of metal atoms associated with each adsorbed gas molecule and depends on the adsorption mechanism:
- Linear: SF = 1
- Bridging: SF = 0.5
- Multi-type (on oxides): SF = 1–n
Metal dispersion indicates the percentage of metal atoms located on the surface:
Dispersion (%) = [Adsorption (µmol/g) × Relative atomic mass (g/mol)] / [Metal loading (%) × Stoichiometric factor × 100]
Where:
Crystallite size can be estimated using geometric models. Two common models are:
Hemispherical Model:
Particle diameter (Å) = 6 × 10⁶ / [Density (g/cm³) × Max SSA (m²/g) × Dispersion (%)]
Cubic Model:
Cube edge length (Å) = 5 × 10⁶ / [Density (g/cm³) × Max SSA (m²/g) × Dispersion (%)]
Where:
Note: These formulas are valid for single-metal catalysts. For bimetallic or alloy systems, peak separation via Temperature-Programmed Desorption (TPD) is recommended for accurate analysis.
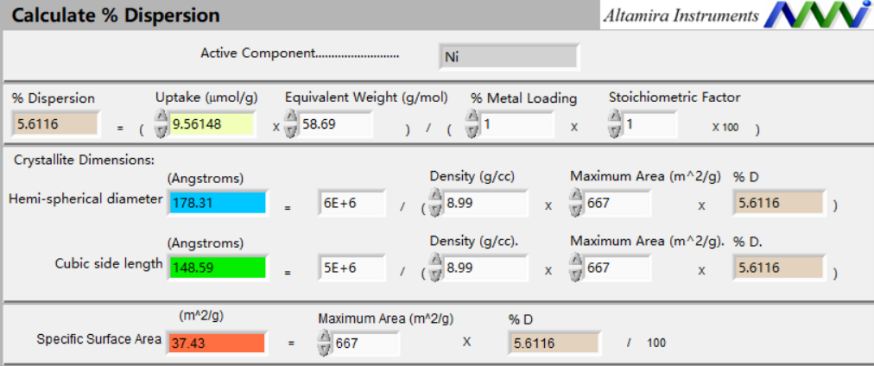
Figure 4: Software Calculation Interface
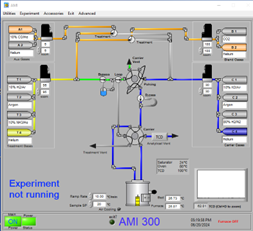
The metal dispersion degree of a 1 wt% Pt/CeO₂ catalyst was measured using the AMI-300 chemisorption analyzer, known for its high performance and precision in pulse chemisorption experiments.
The sample underwent a pre-treatment process prior to measurement. The conditions are outlined below:

The pulse chemisorption experiment was conducted under the following operating parameters:
Following the pre-treatment, a series of gas pulses were introduced to the catalyst sample. The resulting TCD response curve reflects the consumption of hydrogen gas over successive pulses until adsorption saturation was reached.
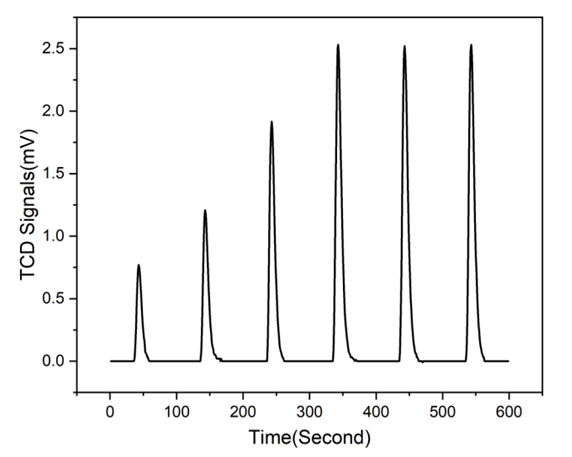
Figure 6: TCD for Pulse Chemisorption
Based on the TCD signal and experimental conditions, the hydrogen pulse chemisorption analysis of the 1 wt% Pt/CeO₂ sample yielded the following results:
These results indicate a moderately dispersed Pt phase on the CeO₂ support, with nanoscale crystallites and a high accessible metal surface area of 43.5 m²/g. A dispersion value of 18.5% is typical for platinum catalysts prepared by conventional impregnation methods and subjected to high-temperature calcination, where dispersion often ranges between 10% and 30%. These characteristics suggest the catalyst is well-suited for applications requiring accessible Pt active sites, such as hydrogenation or oxidation reactions.
Accurate quantification of metal dispersion by pulse chemisorption depends on several experimental variables. The following factors can significantly impact data quality and should be carefully considered to ensure reproducible and reliable results.
Some noble metal-supported catalysts (e.g., Pt, Pd, Rh) exhibit the hydrogen spillover effect when using H₂ as the adsorptive gas. This can lead to overestimated dispersion values, occasionally exceeding 100%.
Cause:
Hydrogen dissociates on the metal surface, forming atomic hydrogen that migrates onto the support material (typically a metal oxide). The detector then incorrectly attributes this additional uptake to the metal.
Recommended Solutions:
If the first pulse peak is similar in area to later pulses, the sample may be saturated on the first injection—leading to poor resolution of adsorption behavior.
Cause:
The sample loop volume is too large relative to the adsorption capacity of the catalyst.
Recommended Solution:
A flat adsorption curve may indicate that the gas concentration is too high, resulting in saturation within a single pulse.
Cause:
High adsorbate concentration delivers more reactive gas than the catalyst can gradually adsorb.
Recommended Solution:
In some cases, saturation may not be reached even after many gas pulses.
Cause:
The adsorbate volume per pulse is insufficient for the catalyst’s capacity.
Recommended Solutions:
Temperature has a major influence on adsorption behavior and data accuracy.
Potential Issues at Elevated Temperatures:
Recommended Practices:
Example Conditions:

Figure 7. Pulse loops available for the AMI-300 chemisorption system.
The AMI-300 chemisorption analyzer provides precise, reliable measurement of surface metal dispersion and crystallite size in supported metal catalysts. By enabling control over key parameters—such as gas type, concentration, pulse volume, and temperature—the system supports detailed investigations into:
With its simple operation and high repeatability, pulse chemisorption using the AMI-300 is an indispensable tool for researchers and engineers across a wide range of catalytic and materials science applications.
[1] Whyte T E.Catal Rev, 1973, 8: 117-145
[2] Yang Chunyan, Yang Weiyi, Ling Fengxiang, Fan Feng. Determination of Surface Metal Dispersion of Supported Metal Catalysts [J]. Chemical Industry and Engineering Progress, 2010, 29(8): 1468-1501.
[3] Liu Weiqiao, et al. Practical Research Methods for Solid Catalysts [M]. Beijing: China Petrochemical Press, 2000: 38-39, 44, 230-232.
[4] Chen Songying, et al. Adsorption and Catalysis [M]. Zhengzhou: Henan Science and Technology Press, 2001: 124-125
TEL: +1 262-877-3600
EMAIL:sales@ami-instruments.com
Copyright © 2025 Advanced Measurement Instruments