- Introduction
Polymeric materials have been essential to human life since ancient times, serving basic needs such as clothing, food storage, shelter, and transportation. The evolution of polymer science and industry has closely paralleled the development of human civilization. From natural polymers like cotton, silk, and wood to synthetic fibers, plastics, and rubbers, scientists have continually designed, synthesized, and modified materials to meet practical needs and evolving demands.
Since the turn of the 21st century, polymer research has shifted toward high-performance materials with advanced functionalities. Emerging areas of focus include self-healing polymers, conductive materials, and thermally stable compounds.
1.1 Structure of Nylon Materials
Polyamides (PAs), commonly referred to as nylons, are polymers containing repeating amide groups (—CONH—) along their molecular chains. As one of the five major engineering thermoplastics, nylons exhibit excellent mechanical strength, wear resistance, chemical stability, and electrical insulation. These properties make them widely applicable in electronics, automotive components, aerospace systems, and industrial machinery.
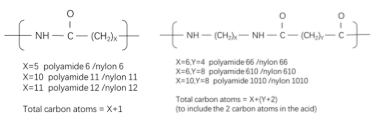
Figure 1: Nylon Nomenclature
Polyamides are typically classified based on their monomer sources:
- AB-type polyamides, synthesized via ring-opening polymerization of amino acids or lactams (e.g., PA6, PA11, PA12)
- AABB-type polyamides, produced via condensation polymerization of diamines and dicarboxylic acids (e.g., PA66, PA46, PA610)
They can also be categorized by chain structure into aliphatic, aromatic, or copolymerized polyamides.
Aliphatic polyamides, formed from aliphatic diacids and diamines (or amino fatty acids), crystallize rapidly, exhibit high crystallinity, and possess balanced mechanical properties. Among these, nylon 11 (PA11) is a key representative.
PA11 is synthesized from 11-aminoundecanoic acid (molecular structure shown in Figure 2), forming a semicrystalline polymer due to its strong intermolecular hydrogen bonding. Polyamides with more than 10 carbon atoms in the backbone are termed long-chain nylons.
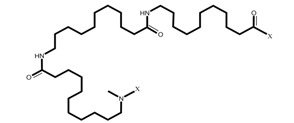
Figure 2: Structure of PA11
PA11 is a translucent, milky white solid with a density of 1.04 g/cm³ and a melting range of 186–190°C. Its key properties include:
- Crystallinity: Strong hydrogen bonding leads to a crystalline structure, though uneven bond distribution results in lower overall crystallinity. Melt crystallization forms irregular lamellae. X-ray diffraction shows at least three polymorphs (α, δ, γ), with hydrogen bonding strength ranked α < δ < γ.
- Moisture Resistance: Due to the low concentration of polar amide groups, PA11 absorbs minimal water.
- Thermal Behavior: Dual melting peaks (185°C and 190°C) appear after annealing at 180°C. Glass transition temperature (Tg) is ~43°C.
- Electrical Properties: Low water uptake ensures stability in humid environments.
PA11 is known for its wear resistance, surface smoothness, and corrosion resistance—ideal for:
- Piping: Used in pneumatic brake lines, fuel lines, and pipeline systems.
- Coatings: Powder coatings improve adhesion, appearance, and durability for equipment
- such as hospital beds, office furniture, and sporting goods.
Aromatic polyamides contain benzene rings and amide groups in their backbone and fall into two categories: fully aromatic and semi-aromatic.
Fully aromatic polyamides, formed by condensing aromatic diamines and diacids, feature rigid, densely packed benzene rings and strong intermolecular hydrogen bonds. This results in high strength, thermal resistance, and low moisture absorption.
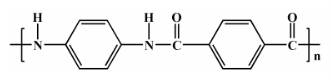
Figure 3: Structure of PPTA
A classic example is poly(p-phenylene terephthalamide) (PPTA), shown in Figure 3, which has a linear, rigid-rod structure. Its extended conformation enables high crystallinity, rigidity, and a melting point above 500°C. However, PPTA decomposes before it can melt, making it unsuitable for conventional melt processing like extrusion or injection molding. Applications include aerospace, defense, flame-retardant clothing, and ballistic protection.
Semi-aromatic polyamides, such as poly(hexamethylene terephthalamide) (PA6T), are synthesized by reacting aromatic and aliphatic monomers. The chemical structure of PA6T, derived from terephthalic acid (PTA) and hexamethylenediamine (HMDA), is shown in Figure 4.
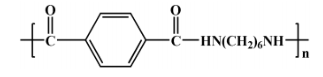
Figure 4: Structure of PA6T
PA6T retains some flexibility and crystallinity while gaining thermal stability and rigidity through aromatic ring incorporation. It exhibits:
- Higher mechanical strength and thermal resistance than aliphatic nylons
- Lower water absorption and superior dimensional stability
- Excellent chemical resistance, tolerating oils, fuels, antifreeze, and high temperatures.
However, like PPTA, PA6T’s high melting point (~370°C) exceeds its decomposition temperature (~350°C), requiring copolymer modification to reduce processing temperatures. For example, PA66/PA6T copolymers allow better processability due to structural similarity between monomers, enabling cocrystallization with minor lattice defects while preserving hydrogen bonding. (Structure shown in Figure 5.)
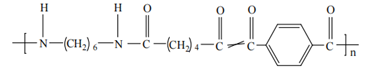
Figure 5: Structure of PA6T/66 Copolymer
Key properties of PA6T-based nylons include:
- High melting points, glass transition temperatures, and crystallinity
- Low water absorption and minimal dimensional change
- Excellent solvent and oil resistance
- Low thermal expansion
- Outstanding wear, fatigue, and creep resistance
- Excellent shape retention with minimal warping
- Strong weldability for dip or reflow soldering
These materials are widely used in automotive and electronics, especially in high-temperature or high-performance applications. Common commercial grades include:
- Series A: Standard mechanical and thermal grades
- Series C: High-flow materials for film and molding
- Series AE: Low-friction variants for rotating or sliding parts
1.2 Melting and Crystallization Behavior of Nylons
Crystallization in polymers involves two stages: nucleation and crystal growth. Nucleation may be homogeneous, occurring spontaneously within the melt, or heterogeneous, typically initiated at impurities or filler surfaces. In practice, heterogeneous nucleation dominates due to unavoidable impurities.
Crystallizability depends on molecular structure: polymers with simple, symmetric, flexible chains and small side groups tend to crystallize more easily.
In nylons, amide groups form strong hydrogen bonds (-NH⋯O=C-) that promote two-dimensional sheets, which then stack into three-dimensional crystalline structures. Differences in hydrogen bond arrangements and stacking yield various polymorphs.
Polyamides crystallize both during melt cooling and from the amorphous state. Imperfect crystals formed during initial cooling may undergo secondary crystallization. Upon reheating, these structures reorganize into more thermodynamically stable forms.
This study uses TGA (thermogravimetric analysis) and DSC (differential scanning calorimetry) to investigate the thermal stability and melting/crystallization behavior of two representative nylons: aliphatic PA11 and semi-aromatic PA6T.
- Test
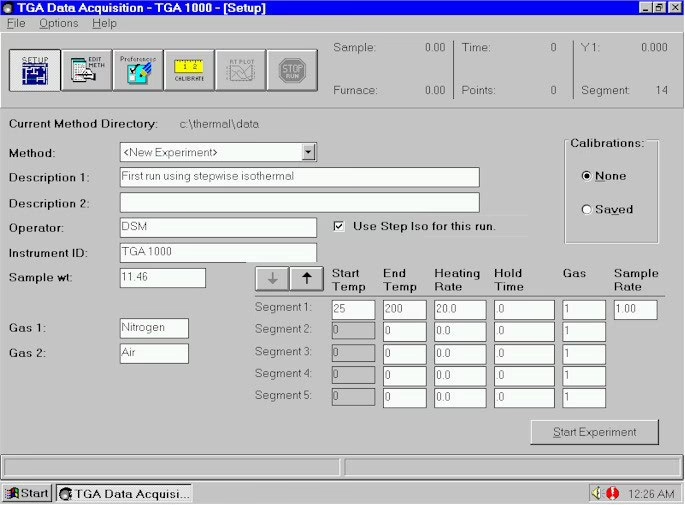
2.1 Instrumentation
Thermal properties were measured using the TGA-1000 thermogravimetric analyzer and DSC-600 differential scanning calorimeter, both developed by AMI. The DSC system was equipped with a mechanical refrigeration unit. (Figure 6)
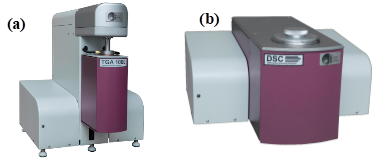
Figure 6 (a) TGA-1000 Thermogravimetric Analyzer, (b) DSC-600 Differential Scanning Calorimeter
2.1.1 TGA Analysis
- Atmosphere: High-purity nitrogen (99.999%) at 50 mL/min
- Sample: ~15 mg in ceramic crucibles
- Program: Heated from 25°C to 1000°C at 10°C/min
2.1.2 DSC Analysis
- Atmosphere: High-purity nitrogen (99.999%) at 30 mL/min
PA11 Test Conditions:
- Sample: ~20 mg in sealed aluminum crucibles
- Temperature range: -90°C to 300°C at 20°C/min
PA6T Test Conditions:
- Sample: ~5 mg in sealed aluminum crucibles
- Two heating-cooling cycles: 50°C ↔ 350°C at 20°C/min
- Results and Discussion
3.1 Thermal Stability Analysis
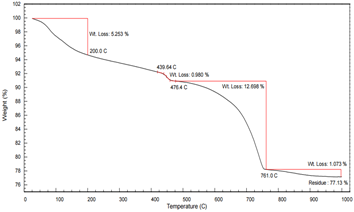
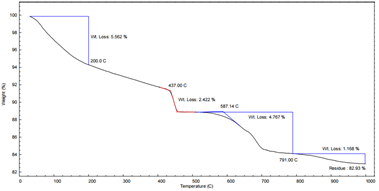
The TGA curves for PA11 and PA6T are shown in Figure 7.
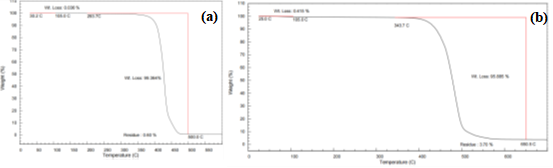
Figure 7 (a) TGA Curve of PA11, (b) TGA Curve of PA6T
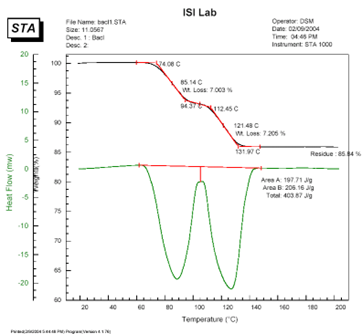
Both materials showed two-stage decomposition:
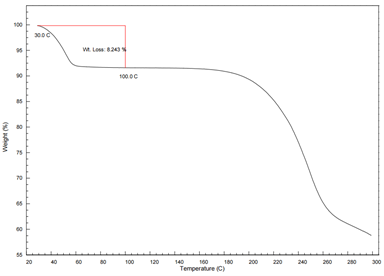
- Stage 1 (30–105°C):
- Minor weight losses from moisture evaporation
- PA11: 0.036%
- PA6T: 0.415%
- Consistent with low hygroscopicity of polyamides
- Stage 2:
- Major decomposition due to random scission of C–C and C–N bonds
- PA11: 99.364% weight loss
- PA6T: 95.885% weight loss
Decomposition temperatures reflect material stability:
- PA11 (aliphatic): 293.7°C
- PA6T (semi-aromatic): 343.7°C
- Increased thermal resistance in PA6T is attributed to aromatic ring content and stronger hydrogen bonding.
3.2 DSC Analysis
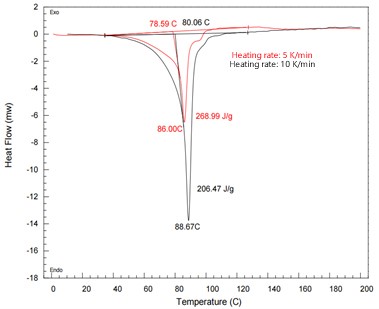
PA11 DSC Curve – see Figure 8:
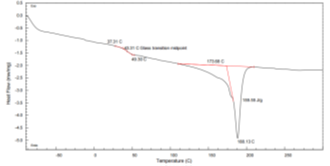
Figure 8 DSC Thermogram of PA11
- Glass transition onset: ~37°C
- Tg: 43.31°C
- Melting onset: 173°C
- Melting peak: 188.13°C
- Enthalpy of fusion (ΔHm): 159.55 J/g
- Thermal stability confirmed: Decomposition occurs well above melting
PA6T DSC Curve – see Figure 9:
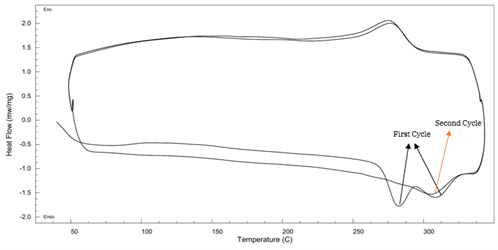
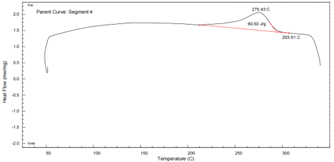
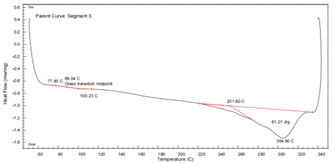
Figure 9 DSC Thermogram of PA6T
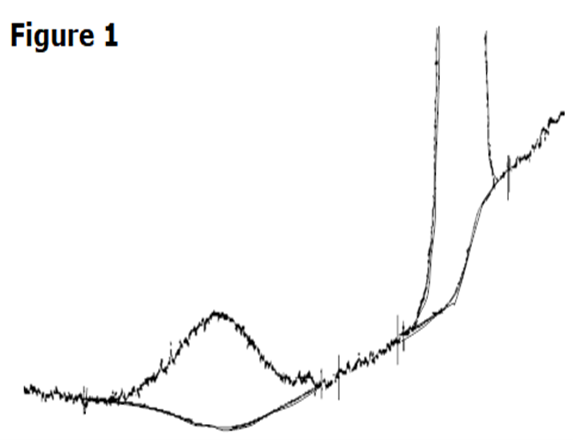
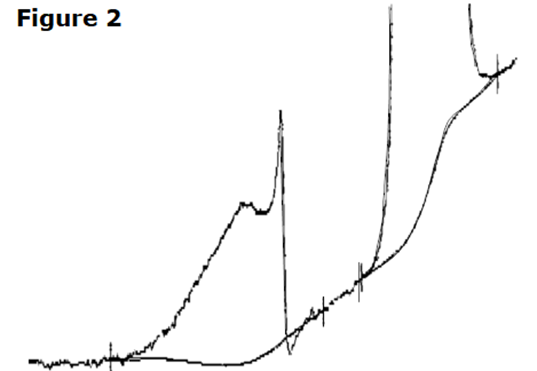
- First heating shows dual melting peaks, indicating recrystallization.
- Second heating shows a single sharp peak at 304.6°C.
- ΔHm: 61.21 J/g
- Higher glass transition (89°C) and crystallization temperature (275.43°C) than PA11
- Superior thermal properties make PA6T ideal for high temperature environments
- Conclusion
This study examined the thermal stability and melting/crystallization behavior of aliphatic PA11 and semi-aromatic PA6T using TGA and DSC.
Key findings include:
- Thermal decomposition:
- PA11: 293.7°C
- PA6T: 343.7°C
- Melting temperature:
- PA11: 188.13°C
- PA6T: 304.6°C
The aromatic structure in PA6T significantly improves thermal resistance and structural stability, making it well-suited for demanding engineering applications. These results highlight the critical role of molecular architecture in determining nylon performance across temperature-sensitive environments.
 Products
 Products


 TEL: +1 262-877-3600
 EMAIL:sales@ami-instruments.com