 Products
 Products
Advanced Measurement Instruments
 TEL: +1 262-877-3600
 EMAIL:sales@ami-instruments.com
Copyright © 2025 Advanced Measurement Instruments
Introduction
Thermogravimetric analysis (TGA) is a powerful tool for studying crystalline hydrates. In addition to quantifying water of hydration, TGA provides detailed insight into dehydration kinetics and mechanisms. This application note explores the thermal behavior of a hemi-hydrate compound using both isothermal and scanning TGA experiments. The results highlight sequential dehydration behavior, model-based kinetic evaluation, and the role of diffusion-controlled mechanisms.
Experimental Overview
A crystalline organic hemi-hydrate was analyzed via isothermal TGA at multiple temperatures: 50°C, 55°C, 60°C, and 77°C. Each sample was held under constant temperature while weight loss was recorded over time. The total dehydration corresponds to the release of 0.5 mol of water per mole of compound, or approximately 2.7% of the sample’s initial mass.
Results and Observations
Across all isothermal conditions, water release occurred in distinct stages. At lower temperatures, the dehydration began abruptly, then slowed, accelerated again, and gradually tapered off as full dehydration approached. This behavior indicates a complex sequence of water loss rather than a single kinetic step.
Weight loss data were processed to generate fractional decomposition profiles (α). Despite the sequential nature of the dehydration, a global linear regression approach was used to estimate apparent rate constants for each temperature. These values were then used in an Arrhenius plot to estimate the activation energy (Ea), yielding a value of approximately 29 kcal/mol.
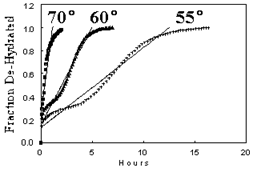
Figure 1: Fractional weight loss profiles (α vs. time)
To better understand the stepwise kinetics, a detailed kinetic model analysis was applied to the 55°C isotherm. Two common diffusion-controlled models were considered, as described in Byrn’s work on solid-state chemistry [1]:
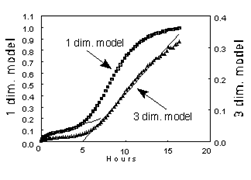
Figure 2: Comparison of model fits to experimental data at 55°C.
These observations suggest that water at the crystal surface escapes rapidly once liberated, while deeper hydration layers require diffusion through dehydrated material, a classic feature of diffusion-limited kinetics.
Conclusion
Thermogravimetric analysis offers more than just quantitative mass loss data. It provides real-time visibility into dehydration mechanisms and supports kinetic modeling. In this study:
These findings demonstrate how TGA can be used not only to monitor weight loss, but to understand complex solid-state transformations relevant to pharmaceuticals, materials science, and process engineering.
AMI TGA systems provide the sensitivity, stability, and flexibility needed to conduct high-resolution kinetic studies without the complexity or cost of mass flow controllers. For more information, contact us at info@ami-instruments.com.
Reference
[1] Stephen R. Byrn, Solid State Chemistry of Drugs, Academic Press: New York, 1982.
TEL: +1 262-877-3600
EMAIL:sales@ami-instruments.com
Copyright © 2025 Advanced Measurement Instruments