Understanding Temperature-Programmed Reduction (TPR) for Catalysis: Parameters and Profiles

Temperature-programmed reduction (TPR) is a powerful technique for obtaining direct information on the reducibility of catalysts and catalyst precursors.
Bitmap (54)

What TPR Measures and Why It Matters

TPR is widely used to characterize catalyst materials by monitoring how a reducing agent (commonly hydrogen diluted in an inert gas) is consumed as temperature increases linearly. Because the consumption signal correlates with reduction behavior, the resulting profile can be used to evaluate both the ease and extent of reducibility.

In a typical TPR experiment, the sample is exposed to a flowing mixture of a reducing agent—such as hydrogen diluted in an inert gas—while the temperature is increased linearly. The consumption rate of the reducing agent is continuously monitored and correlated to the reduction behavior of the sample.

Example TPR Profile: How to Read Peak Temperature and Peak Area

Figure 1 presents a representative TPR profile for a 10% NiO/SiO₂ catalyst using a 10% H₂/Ar gas mixture at a flow rate of 30 mL/min and a linear heating rate of 20 K/min. The resulting profile provides insights into both the ease of reducibility (indicated by the temperature at the reduction peak maximum) and the extent of reducibility (reflected by the signal area).

A comprehensive description of TPR methodology can be found in Temperature-Programmed Reduction for Solid Materials Characterization by A. Jones and B.D. McNicol (Marcel Dekker, Inc., 1986).


Bitmap (54)

Figure 1. Temperature-programmed reduction (TPR) profile of a 10% NiO/SiO₂ catalyst (10% H₂/Ar, 30 mL/min, heating rate 20 oC/min).


Why Comparing TPR Data Across Labs Can Be Difficult

Comparing TPR results across different laboratories or literature reports can be challenging because there are no universally accepted experimental parameters for TPR experiments. Variables such as heating rate, reducing gas composition, flow rate, and particle size can all significantly influence the reduction profile.

This AMI note explores the impact of key experimental parameters on TPR results.

Recommended Instruments and Next Step

If you’re planning TPR/TPD/TPO work, explore AMI’s Chemisorption systems and see the AMI‑300 platform. For pricing or configuration help, contact AMI.

Key Experimental Parameters That Shift the TPR Peak (Tm)

Heating Rate and Hydrogen Concentration (First-Order Reduction)

Monti and Baiker [1] developed an equation that relates the peak temperature (Tm) to the linear heating rate and hydrogen concentration for a first-order reduction process.

Background 2026 02 10T214404.582
where: 

Tm is the temperature at maximum signal; 

[H2] is the average hydrogen concentration; 

rT is the linear heating rate; 

Ea is the activation energy of reduction; 

R is the gas constant; and 

A is a pre-exponential factor. 

The equation predicts a decrease in Tm with increasing hydrogen concentration and with decreasing heating rate. It also predicts that the observed temperature maximum is independent of flow rate—a prediction that is not supported by experimental observations.

How to Use the Equation to Compare Different Conditions

The primary value of this equation lies in its ability to compare data obtained under different conditions. For example, Gentry and coworkers [2], in a study of CuO, determined Ea to be approximately 67 kJ/mol. Using a flow rate of 20 mL/min, a heating rate of 6.5 K/min, and an H₂ partial pressure of 0.1, they observed Tm = 280ºC. Applying their results to equation (1), it becomes possible to predict Tm for other experimental conditions.

Figure 2 illustrates how the predicted Tm for CuO would vary with different hydrogen concentrations and linear heating rates according to equation (1).

Flow Rate Effects: Practical Guideline

The effects of flow rate are more complex and less easily predicted. Intuitively, one would expect Tm to decrease with increasing flow rate, and this trend is confirmed in the literature.

Monti and Baiker [1] observed a decrease in Tm of 15°C for supported NiO when the total flow rate was increased from 30 mL/min to 60 mL/min. Similarly, in TPR studies of CuO using 5% H₂ and a heating rate of 20 K/min, increasing the flow rate from 30 mL/min to 80 mL/min resulted in a Tm decrease of 15°C. As a general guideline, a doubling of the flow rate typically results in a Tm decrease of approximately 10–20°C.

Particle Size and Reduction Mechanism

Because TPR is a bulk process, not all particles are exposed to the reducing gas simultaneously, making Tm dependent on particle size. However, predicting this dependence is complicated by the specific reduction mechanism involved.

Lemaitre [3] examined this dependence across different reduction mechanisms, highlighting two that are especially relevant for catalysis:
  •        Phase-boundary-controlled reduction, typical of bulk oxides
  •        Nucleation-controlled reduction, typical of supported metals
Interestingly, the predicted relationship between Tm and particle size varies with the reduction mechanism. For bulk oxides, Tm increases with particle size, whereas for supported metals, Tm decreases as particle size increases.

Summary of Combined Effects

These various factors—and their combined effects on the TPR profile—are summarized in Figure 3. All should be carefully considered when comparing data from different laboratories or experimental setups.

Bitmap (55)

References

(1) A.M. Monti and A. Baiker, J. Catal. 83, 323 (1983).

(2) J. Gentry, N.S. Hurst, and A. Jones, J. Chem. Soc., Faraday Trans. I 75, 1688 (1979).

(3) L. Lemaitre, in Characterization of Heterogeneous Catalysts, F. Delannay (Ed.), Marcel Dekker, Inc.

Send Us A Message

Frequently Asked Questions

In general, a lower peak temperature (Tm) suggests the material reduces more easily under the tested conditions.

Changing heating rate affects the time available for reduction at each temperature, which can shift the observed peak temperature.

Yes. While some models predict no dependence, experimental data commonly show Tm decreases as flow rate increases.

Because parameters like heating rate, gas composition, flow rate, and particle size can all shift the profile, making direct comparisons unreliable without normalization.

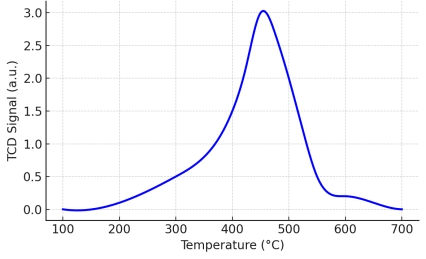
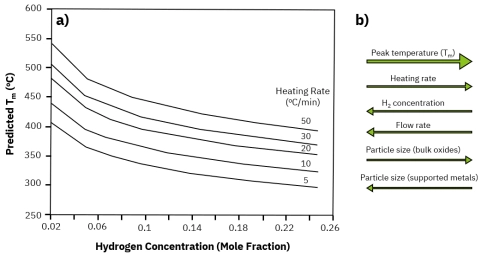
Direct comparison of TPR data is challenging because key experimental parameters—such as heating rate, hydrogen concentration, gas flow rate, and particle size—can significantly shift the reduction peak temperature (Tm) and alter the profile shape. Without matching or normalizing these conditions, differences in TPR profiles may reflect experimental setup rather than intrinsic catalyst reducibility.

Other Technical Libraries