Temperature-Programmed Desorption: Analyzing Adsorbed Species from Catalyst Surfaces

Understanding TPD kinetics, surface characterization, and desorption dynamics for heterogeneous catalyst analysis.

Bitmap (83)

Introduction to Temperature-Programmed Desorption in Catalyst Analysis

Temperature-programmed desorption (TPD) of species chemically adsorbed (chemisorbed) on the surface of metal oxides or supported metal catalysts is a technique commonly applied in the characterization of heterogeneous catalysts. TPD can provide information about surface acidity/basicity, reaction kinetics, metal dispersion, and reaction mechanisms. For supported metal catalysts, the chemisorption uptake may be used to calculate an average metal crystallite size. This information provides a basis for comparing the performance of different catalysts.

Different catalyst preparations may vary significantly in characteristics such as composition, density of the material or metal weight loading. The chemisorption characteristics of a catalyst may be more closely related to the catalyst's chemical activity than these other physical characteristics. Knowledge about sites for chemisorption may be used to develop catalytic rate expressions based on the number of adsorption sites rather than the gross catalyst weight or volume. Catalyst activity given on a per site basis makes comparison of the true efficiency of different catalysts more meaningful.

TPD Experimental Methods and Catalyst Characterization

A typical TPD experiment consists of several critical steps that must be carefully controlled to obtain reliable, quantitative results:

Pretreatment of Catalyst Samples

The sample is first subjected to calcination, reduction, or out-gassing usually at elevated temperatures to remove water and impurities and to prepare the catalyst surface for the chemisorption step. This pretreatment is essential for generating clean, reactive metal surface sites.

Chemisorption Process

The sample is contacted with the molecule of interest in one of several different modes, including pulse adsorption, steady flow adsorption, or static non-flow adsorption. The chemisorption process may be carried out to the extent that the surface is fully covered with adsorbing molecules or to some fraction of full coverage.

Temperature-Programmed Desorption Analysis

After the surface has been contacted with the adsorbing molecule to achieve the desired coverage, the temperature of the system is raised in a linear fashion while a constant flow of an inert gas passes over the catalyst. Desorbing molecules leaving the catalyst surface are swept into this stream of inert gas and are carried to a detector which monitors the amount of gas and the temperature at which it desorbs. Desorption into this gas stream occurs when an adsorbed species gains enough energy to overcome the activation energy barrier to the desorption process.

For optimal pretreatment and catalyst characterization, advanced TPD instruments are essential for achieving clean, reactive metal surface sites with precise control over all experimental parameters.

Interpreting TPD Results and Desorption Profiles

TPD experimental results are presented as a plot of detector signal intensity (which can be calibrated to give its relationship to the amount of gas desorbing) versus sample temperature. A TPD plot can provide information about the number of surface sites exposed and available for chemisorption of a molecule of interest. The number of adsorbed molecules is found simply by integrating the area under the desorption curve. Chemical properties of the chemisorption sites can also be investigated by TPD.

Analyzing Peak Positions and Binding Energies

Generally, molecules that are weakly bound to the surface desorb at lower temperatures, and those strongly bound to the surface require higher temperatures to desorb. This is modeled in the representative TPD plot, showing two representative peaks for a weakly bound adsorbate (Peak A) and a strongly bound adsorbate (Peak B). The relative quantity of each species can be determined by integrating the area under each peak.

Bitmap (83)

Figure 2 shows intensity of the desorbed molecule signal as a function of temperature, with Peak A representing weakly adsorbing species and Peak B representing strongly adsorbing species.

Extracting Kinetic Information from TPD Data

In addition to providing a quantitative measurement of gas uptake by a catalyst surface, TPD experimental results also contain information about kinetic parameters of the adsorption-desorption processes on the catalyst surface. These parameters may be obtained from the known quantities of inert gas flow rate, linear heating rate and desorption peak temperatures. Several papers have discussed the equations which describe the desorption of molecules from catalyst surfaces. These equations give rate constants and activation energies, as well as the order of the desorption process. Comparison of these parameters for a series of catalysts may delineate trends which help to explain observed differences in catalyst performance.

Modern chemisorption analyzers can automatically calculate rate constants, activation energies, and desorption orders with high precision, ensuring accurate kinetic analysis without manual complications. Caution must be taken, however, in utilizing this kinetic information because, as described below, heterogeneous catalyst systems often present experimental complications not addressed in kinetic treatments developed for simpler cases.

Variables Affecting TPD Experiments and Desorption Measurements

One important feature of TPD that should be kept in mind is the transient nature of the experiment. Three variables change continuously over the time of the experiment:

✓ Temperature ✓ Surface coverage of the adsorbate ✓ Desorption rate

These variables are plotted qualitatively showing the implication that a TPD experiment is always performed under changing conditions which may be far removed from reaction conditions under which the catalyst is likely to be used. Thus, it is quite important to understand how to interpret TPD spectra so that proper relationships between desorption characteristics and activity of a catalyst may be established.

Bitmap (84)

Figure 3 shows the relationship between TPD variables as a function of time: temperature (red), adsorbate surface coverage (blue), and adsorbate desorption rate (black).

Impact of Heating Rate on Desorption Temperature

Changing the linear temperature ramp rate for desorption causes the temperature of desorption (Tdes) to change. This relationship is described in the Redhead equation; higher heating rates increase the temperature of desorption. Additionally, species re-adsorption adds a time increment to the normal time it takes for a desorbing molecule to reach the detector, which is not accounted for in the Redhead equation.

Bitmap (85)
The heating rate directly influences the measured desorption temperature, with faster heating rates shifting peaks to higher temperatures. This parameter must be controlled and documented for accurate TPD comparisons.

Bitmap (86)
Tdes = desorption temperature 

ν = pre-exponential factor, typically assumed to be  1013 s-1 

β = heating rate 

R = gas constant 
Gas Flow Rate Effects on Desorption Detection

The flow rate of inert gas over the catalyst surface during TPD will also influence TPD curves. Higher flow rates carry desorbed molecules to the detector more quickly and hence minimize the time lag between the actual desorption temperature and the detected desorption temperature. For example, suppose that the experiment with a catalyst sample was carried out with an inert gas flow rate of 25 mL/min in a tubular sample cell with 10 mL volume between the catalyst bed and the detector. Increasing the flow rate to 200 mL/min cuts the total time lag, reducing the difference between the true and detected desorption temperatures.

Sample Porosity and Mass Transfer Limitations

Quantitative treatment of desorption kinetics has been developed for the case of desorption from homogeneous, nonporous surfaces as well as for the more complicated cases which can arise for porous heterogeneous catalysts. One of the most important of these complications is that species desorbing from porous surfaces may be held up as they diffuse through the catalyst pores by re-adsorbing on sites along the molecule's pathway in the pore.

Desorption from homogeneous, flat samples such as single crystals of metals results in "flash desorption" in which there is very little holdup between the surface and the detector. Desorption from porous samples, however, can be followed by slow diffusion through pores and even re-adsorption onto other surface sites. This wandering path of the desorbing molecules causes them to arrive at the detector much later.


Bitmap (87)

Figure 4: Diagram comparing the geometrical differences between species A desorbing from a homogeneous flat surface (left) and porous  sample (right).

Optimizing TPD Experimental Conditions

Minimizing Gas Re-adsorption Effects

The examples above show that decreasing the ramp rate and increasing the inert gas flow rate both help to close the gap between true and detected desorption temperatures. Increasing the flow rate can certainly minimize the lag time between the end of the sample bed and the detector, but it has little effect on the residence time of desorbing molecules within the catalyst bed itself. Internal diffusion rates in catalyst micropores are not affected by changes in the flow rate of gas outside the pore. In addition, the time lag is due not only to diffusion of the desorbing gas but also due to its re-adsorption on sites within the catalyst pores. The adsorption residence time on catalyst surface sites is not affected by external gas flow rate.

Decreasing the temperature ramp rate can lessen the temperature lag between true and detected desorption temperature, but it can also change features of the desorption curves. A desorption trace recorded at a slower ramp rate appears to be "flattened". For molecules adsorbed on a heterogeneous surface, a wide spectrum of energies of desorption can exist. At slower ramp rates, desorption is spread out over longer time. Some amount of desorbing gas below the detector's "threshold" is always undetected due to experimental constraints, and the slower desorption occurring at slower ramp rates results in a larger fraction of the gas being "lost" below the threshold detection limit.

Bitmap (88)

Figure 5: TPD plots comparing the fractions of desorbed gas ”lost” below the instrument threshold of detection at heating rates of 25 oC/min (left) and 5oC/min (right).

Best Practices for TPD Fingerprinting

While changes in the experimental conditions can't negate all the problems inherent in studying desorption from heterogeneous surfaces, there is quite a lot to be learned by trying different flow rates and ramp rates for TPD experiments over any given catalyst. Investigating the desorption spectra for a variety of conditions can often help to develop a standard experimental technique to be used for a whole series of catalysts. This method of "fingerprinting" catalysts is a useful means of recording trends in adsorption and desorption to compare with trends in catalyst performance.

Applications of TPD in Catalyst Characterization

Temperature-programmed desorption has become an indispensable tool in modern catalyst development and characterization. The technique provides researchers with critical information about:

  • Surface Acidity/Basicity: Understanding acid and base site distribution across catalyst surfaces
  • Metal Dispersion: Calculating the fraction of metal atoms exposed on the surface
  • Reaction Mechanisms: Identifying key intermediates and their thermal stability
  • Catalyst Comparison: Ranking catalysts based on per-site activity
  • Quality Control: Establishing consistent characterization protocols for catalyst batches
By combining TPD with other complementary characterization techniques, researchers can develop a comprehensive understanding of catalyst surface properties and predict catalytic performance with greater accuracy.

Conclusion: TPD as a Critical Catalyst Characterization Tool

Temperature-programmed desorption remains one of the most powerful and widely applied techniques for heterogeneous catalyst characterization. The ability to simultaneously measure surface site quantity, binding strength, and desorption kinetics makes TPD invaluable for both academic research and industrial catalyst development.

Understanding the experimental variables that affect TPD results—heating rate, gas flow rate, sample porosity, and re-adsorption effects—is essential for obtaining reliable, reproducible data. With proper instrument control and careful experimental design, TPD provides the quantitative, site-specific information needed to optimize catalyst formulations and predict catalytic performance.

For laboratories and research institutions seeking comprehensive catalyst characterization solutions, advanced TPD instrumentation combined with complementary characterization methods provides a complete analytical platform for materials science and catalysis research.

References

(1) Cvetanovic, R. J. and Amenomiya, Y. Application of a temperature-programmed desorption technique to catalyst studies. Adv. Catal., 1967, 17, 103-149.

(2) Schmidt, L. D. Adsorption binding states on single-crystal planes. Catal. Rev., 1974, 9, 115.

(3) Schwarz, J. A. and Falconer, J. L. Temperature-programmed desorption and reaction: Applications to supported catalysts. Catal. Rev., 1983, 25, 141-227.

(4) Herz, R. K.; Kiela, J. B.; Marin, S. P. Adsorption effects during temperature-programmed desorption of carbon monoxide from supported platinum. J. Catal., 1982, 73, 66-75.

(5) Gorte, R. J. Design parameters for temperature programmed desorption from porous catalysts. J. Catal., 1982, 75, 164-174.

Send Us A Message

Frequently Asked Questions

Temperature-programmed desorption (TPD) is a surface analysis technique used to study molecules chemically adsorbed on catalyst surfaces. In a TPD experiment, the catalyst is heated at a controlled linear rate under an inert gas flow, causing adsorbed species to desorb. By monitoring the desorbed molecules as a function of temperature, researchers can determine surface site density, binding strength, and adsorption kinetics.

TPD provides quantitative information about surface acidity or basicity, metal dispersion, adsorption site density, and desorption activation energies. By integrating the area under desorption peaks, the total number of adsorbed molecules can be calculated. Peak temperatures also indicate binding strength, enabling comparison of catalyst performance on a per-site basis rather than by bulk composition.

The heating rate directly influences the measured desorption temperature (Tdes). According to the Redhead equation, higher heating rates shift desorption peaks to higher temperatures. Slower heating rates improve resolution but may flatten peaks and increase signal loss below the detection threshold. Therefore, heating rate must be carefully controlled and documented for reliable catalyst comparison.

Inert gas flow rate affects the time lag between actual desorption and detection. Higher flow rates reduce external transport delay and improve the accuracy of measured desorption temperatures. However, flow rate does not eliminate internal diffusion or re-adsorption effects within porous catalysts, which can still broaden or shift TPD peaks.

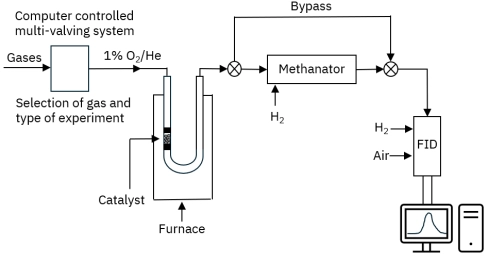
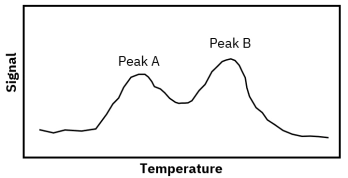
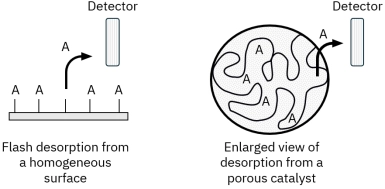
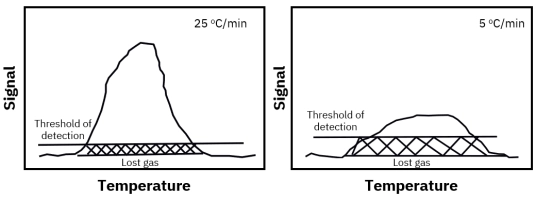
Porous catalysts introduce mass transfer limitations because desorbing molecules may diffuse slowly through pores and re-adsorb on internal surface sites before reaching the detector. This can delay detection and distort kinetic interpretation. Proper control of heating rate, flow rate, and experimental standardization is essential for reliable TPD fingerprinting and catalyst comparison.

Other Technical Libraries