Learn how the Densi 100 True Density Analyzer is used to measure the true density of ceramic fracturing proppants. Ensure the quality of your proppants with AMI.
Explore how silver powder specific surface area impacts photovoltaic silver paste performance. Detailed analysis of particle size, surface area, and solar cell efficiency.

Photovoltaic silver paste is an indispensable core component of solar cells, and its quality directly affects the solar cell performance. Silver paste is typically coated onto the front and back of the cell in a grid formation and adhered by rapid heating (sintering), and the silver grid serves as a highly conductive electron network. Usually, silver powder accounts for 70-90% of the paste by weight, therefore silver material properties will directly affect the overall performance of photovoltaic silver paste. Shape, particle size, dispersion, and specific surface area affect the properties of silver powder.
Two of the common silver particle shapes are:Spherical – good dispersibility Flake – higher surface area and densityPhotovoltaic silver paste is often applied to both the front and back of the solar cell to complete the electrical circuit, but each side serves a different purpose. The front side of the solar cell faces the sun and is designed for light adsorption and current collection, and the back side of the cell is typically designed to house electrical connections. Front-side silver paste is typically comprised of spherical silver powder due to the improved dispersibility and narrow particle size distribution to ensure high photoelectric conversion and stability, and back-side silver paste is often comprised of larger silver flakes for improved electrical contact and lateral conductivity. Learn more about photovoltaic silver paste performance from our comprehensive technical library.
Understanding the Relationship Between Particle Size and Conductivity The front-side silver particle size affects the specific surface area and dispersibility of the silver powder. Smaller silver particles result in larger specific surface area and higher surface activity, which allows for low-temperature sintering of the silver paste. During the sintering process, silver welding to the solar cell surface is likely to occur, which helps to form a dense conductive film and improve conductivity. However, if the silver particles are too small and the specific surface area too large, they may agglomerate during sintering. This reduces the continuity of the electrical network and limits conductivity. If the front-side silver particle size is too large, the specific surface area and the relative contact area will be too small, resulting in increased contact resistance and lower surface activity. Therefore, selecting silver powder with an appropriate particle size is crucial. Our silver particle size and surface area optimization solutions help researchers achieve optimal results. Optimal Particle Size Range for Solar Cells: Spherical silver particles in the range of 1-3 μm with specific surface area between 0.4-1.0 m²/g are typically used in the front side of the solar cell. Silver powder within this particle size range has good fluidity, good conductivity, a controllable rough surface, and can significantly improve the adhesion of the paste.
Why Larger Surface Area Isn't Always Better In summary, the specific surface area of silver powder affects the performance of photovoltaic silver paste. Different silver particle shapes have different surface areas and serve unique functions. A larger specific surface area is not always better, because an excessively large specific surface area of spherical silver powder can adversely affect the performance of the silver paste. Therefore, selecting silver powder selection for solar cells with an appropriate specific surface area is critical for enhancing the performance of conductive silver paste.
Testing Procedures for Silver Powder Analysis The specific surface areas of three different front-side silver materials, A, B, and C, as well as one back-side silver material, D, were measured. The specific surface area of the silver powder was measured using the AMI Sync 400 specific surface area and pore size analyzer from AMI. Approximately 8-10 grams of each silver powder sample were weighed and loaded into static sample tubes for testing. Nitrogen adsorption isotherms were measured at liquid nitrogen temperature, with pressure ranging from 0 kPa to 30 kPa. Two tests were conducted for each type of silver powder material. Our advanced BET analysis and surface area measurement techniques ensure precise and reliable results for all your research needs.
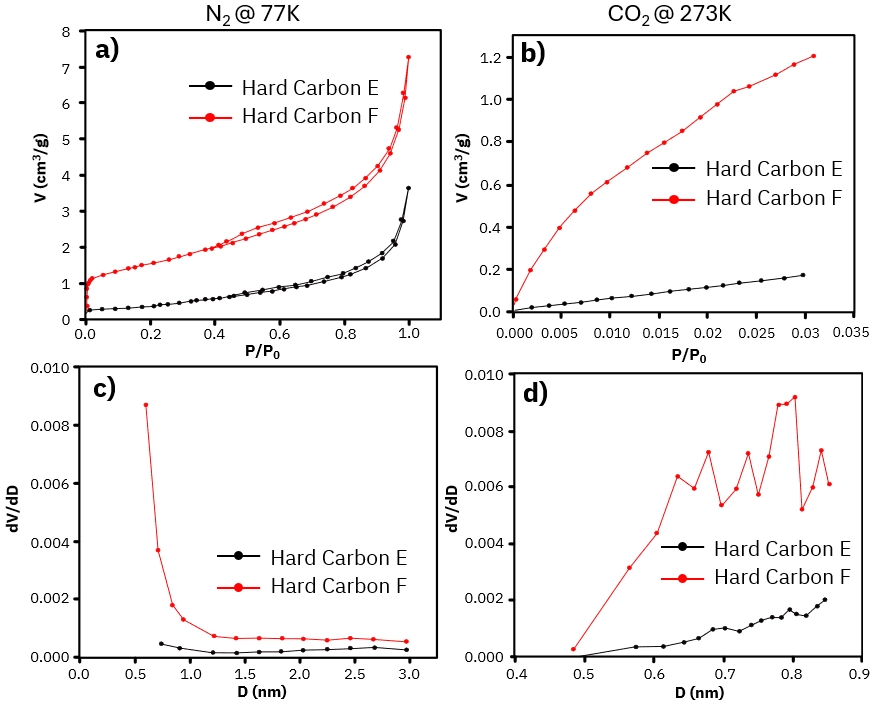
Examining Adsorption Isotherms and Material Stability Figure 1 shows the adsorption isotherms of the four types of silver powder. As can be seen from the figure, the nitrogen adsorption capacity is relatively low for both front-side (Fig. 1a-c) and back-side (Fig. 1d) silver powders. However, since back-side silver typically uses flake-shaped silver powder, its adsorption capacity is greater than that of front-side silver, a phenomenon demonstrated in Figure 1d. To verify the stability of the materials and the instrument, repeatability tests were conducted for each type of silver powder. The isotherms obtained from three BET tests for each of the four silver powder materials, shown in Figure 1, almost completely overlap, which strongly confirms the high stability of both the materials and the instrument. Specific Surface Area Test Results: Table 1 presents the specific surface area test results of the silver powders performed in triplicate. For front-side silver A, the average specific surface area was 0.55 m²/g. For front-side silver B, the average specific surface area was 0.53 m²/g. For front-side silver C, the average specific surface area was 0.53 m²/g. The relative standard deviations (RSD) of the three tests for the three materials were 0.53%, 0.24%, and 0.72%, respectively, all of which are less than 1%. This indicates excellent stability of both the materials and the AMI Sync 400. Table 1: Specific surface area results for silver powders A-D, experiments performed in triplicate
| Material | Front-Side A | Front-Side B | Front-Side C | Back-Side D |
|---|---|---|---|---|
| Average Specific Surface Area (m²/g) | 0.55 | 0.53 | 0.53 | 0.80 |
| RSD (%) | 0.53% | 0.24% | 0.72% | 0.270% |
| Particle Type | Spherical | Spherical | Spherical | Flake-shaped |
| Application | Front-side | Front-side | Front-side | Back-side |
Furthermore, the specific surface areas of the three front-side materials are very close, with silver A slightly larger than silver B, which is very slightly larger than silver C. Based on the specific surface area results, it is predicted that front-side silver A will exhibit the best performance. Silver powder D is a back-side silver material, primarily composed of flake-shaped silver powder. The average specific surface area was 0.80 m²/g, and the RSD was 0.270%, indicating excellent stability. The specific surface area of sample D is significantly larger than that of front-side silver powders A-C, which enhances its conductivity compared to spherical silver powders. However, the poor fluidity of flake-shaped silver powders limits its use to a back-side silver material. Figure 1: Adsorption Isotherms of Silver Powder Materials Figure 1: Isotherms from three BET tests of (a) front-side silver A, (b) front-side silver B, (c) front-side silver C, and (d) back-side silver D under pretreatment conditions of 80°C for 2 hours.
Figure 1 shows the nitrogen adsorption isotherms for all four silver powder samples. The overlapping curves demonstrate the high reproducibility and stability of the measurements. Note the higher adsorption capacity of the flake-shaped back-side silver (d) compared to the spherical front-side materials (a-c).
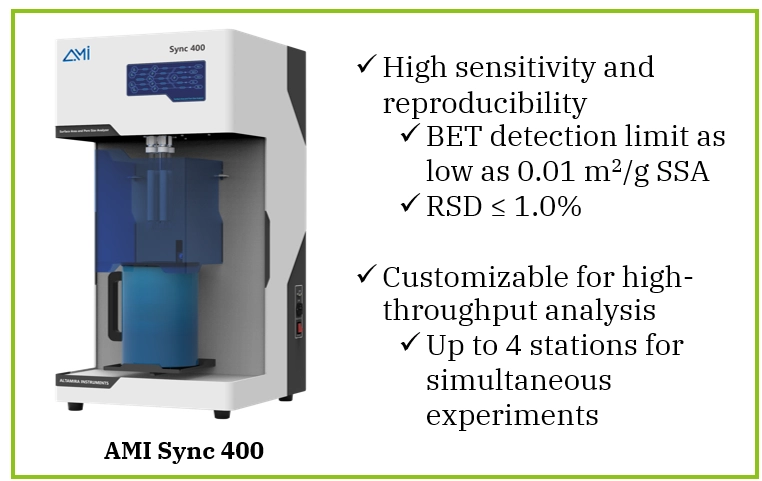
Optimizing Silver Powder Selection for Maximum Solar Cell Efficiency The specific surface area of silver powder is an important indicator for characterizing its performance in photovoltaic cells. The primary factor affecting the specific surface area of spherical silver powder is particle size, which must be carefully tuned for optimal stability and conductivity. The current industry standards for photovoltaic materials specify that the specific surface area of silver powder should be between 0.25 and 1 m²/g. In this study, the specific surface areas of three front-side silver powders and one back-side silver powder are all between 0.5-0.8 m²/g, which confirms that they meet the requirements of the industry standard. The consistent specific surface area measurements with low RSD values also showcase the precision and reliability of the AMI Sync 400. Figure 2: AMI Sync 400 Physisorption Analyzer Figure 2: Highlights of AMI Sync 400 physisorption analyzer and its key features for surface area analysis.

The AMI Sync 400 offers:✓ High sensitivity and reproducibility✓ BET detection limit as low as 0.01 m²/g SSA✓ RSD ≤ 1.0%✓ Customizable for high-throughput analysis✓ Up to 4 stations for simultaneous experimentsScientific Literature on Silver Powder and Photovoltaic Performance (1) Tsai, J.-T. and Lin, S.-T. Silver powder effectiveness and mechanism of silver paste on silicon solar cells. J. Alloys Compd. 2013, 548, 105-109. (2) Li, W.; Yu, C.; Wang, Y.; Yao, Y.; Yu, X.; Zuo, C.; Yu, Y. Experimental investigation of effect of flake silver powder content on sintering structure and properties of front silver paste of silicon solar cell. Materials, 2022, 15, 7142. (3) Lin, S.; He, X.; Shi, H.; He, Q.; Yuan, J.; Duan, J.; Ren, J.; Liu, J. Comprehensive review of photovoltaic paste: Materials, processing, and performance optimization. Sol. Energy Mater. Sol. Cells, 2026, 295, 114013. (4) Shin, D.-Y.; Seo, J.-Y.; Tak, H.; Byun, D. Bimodally dispersed silver paste for the metallization of a crystalline silicon solar cell using electrohydrodynamic jet printing. Sol. Energy Mater. Sol. Cells, 2015, 136, 148-156. (5) Yu, X.; Sun, H.; Qian, Z.; Li, W.; Li, W.; Huang, F.; Li, J.; Gan, G. Effect of silver powder microstructure on the performance of silver powder and front-side solar silver paste. Materials, 2024, 17, 445.
The specific surface area (SSA) of silver powder directly influences sintering behavior, electrical conductivity, and adhesion of photovoltaic silver paste. An optimized SSA ensures efficient formation of a dense conductive network during sintering, improving photoelectric conversion efficiency and overall solar cell performance.
Industry standards typically specify a silver powder specific surface area between 0.25 and 1.0 m²/g for photovoltaic applications. For front-side silver paste, spherical particles with SSA around 0.4–1.0 m²/g and particle sizes of 1–3 μm provide an optimal balance between dispersibility, conductivity, and stability.
Smaller silver particles increase specific surface area and surface activity, promoting low-temperature sintering and improved adhesion. However, excessively small particles may agglomerate, reducing network continuity and conductivity. Conversely, overly large particles reduce contact area and increase resistance. Proper particle size control is essential for maximizing conductivity.
Spherical silver powders offer excellent dispersibility and are commonly used in front-side silver paste for improved printing performance and photoelectric efficiency. Flake-shaped silver powders have higher surface area and enhanced lateral conductivity but poorer fluidity, making them more suitable for back-side silver paste applications.
Specific surface area is typically measured using the BET (Brunauer–Emmett–Teller) nitrogen adsorption method. Instruments such as the AMI Sync 400 physisorption analyzer provide high-precision measurements with low relative standard deviation (RSD ≤ 1%), ensuring reliable characterization of silver powders for photovoltaic applications.

Learn how the Densi 100 True Density Analyzer is used to measure the true density of ceramic fracturing proppants. Ensure the quality of your proppants with AMI.

Learn about pulse chemisorption, a technique for characterizing catalysts and measuring metal surface area. Discover how AMI’s instruments can help you.

Discover how specific surface area and pore structure affect the performance of potassium-ion batteries. Learn how AMI’s instruments can advance your battery research.

Learn how differential scanning calorimetry (DSC) is used to analyze the thermal properties of lipstick. See how the AMI DSC 600 can help you develop high-quality cosmetics.[…]