Temperature-programmed desorption (TPD) of basic probe molecules is a widely used technique for characterizing the acid properties of zeolites. By adsorbing a base onto the zeolite surface, then linearly increasing the temperature under inert gas flow, the desorption of the base can be monitored.
Temperature-programmed desorption (TPD) is a practical way to compare zeolite acidity using a probe base (most commonly NH₃). In one experiment, the desorption signal helps you estimate:
How many acid sites are available
How strong those sites are
This is why NH₃-TPD is frequently used when acidity is expected to influence adsorption, cracking activity, or catalyst performance.
Quantitative analysis of the desorbed species provides information about:
Extrinsic acidity (number of acid sites)
Intrinsic acidity (acid strength, based on desorption temperature)
This approach allows both types of acidity to be evaluated in a single experiment (Figure 1).
An NH₃-TPD curve becomes most useful when you interpret it consistently. Two features typically carry most of the decision-making value: total desorbed amount and where desorption occurs on the temperature axis.
In many practical comparisons, the area under the desorption curve is treated as a proxy for how much NH₃ was retained and then released—often used to compare relative acid site density between samples prepared the same way. For meaningful comparisons, keep adsorption conditions, purge, and ramp rate consistent.
The temperature at peak maximum (Tmax) and the temperature range where desorption occurs are often associated with acid strength. A shift to higher temperature can indicate stronger binding, while multiple peaks typically suggest a distribution of site types rather than one uniform acidity.
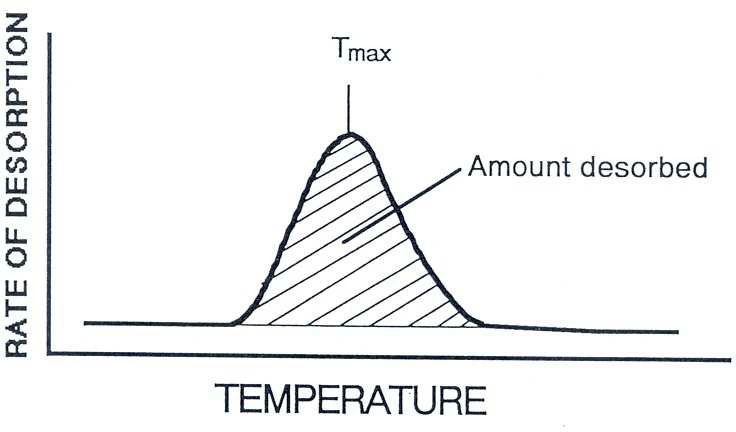
Figure 1. TPD experiment: Tₘₐₓ reflects acid strength (intrinsic acidity); peak area reflects number of acid sites (extrinsic acidity).
It is common to see more than one desorption feature in zeolite NH₃-TPD. Multiple peaks often reflect a mixture of adsorption environments, such as differences in pore accessibility, framework composition, or the presence of multiple site families.
Rather than forcing a single interpretation, treat peak structure as a diagnostic: it can help you compare how acidity changes with synthesis conditions, ion exchange, dealumination, or thermal treatment.
Probe selection depends on what you want to learn—total acidity, accessible acidity, or site type sensitivity.
NH₃ is widely used because it can access many sites, provides strong measurable adsorption, and generates a clear desorption response across a wide temperature range. It is often a good first choice when you need comparative acidity screening across multiple zeolite samples.
Pyridine can be valuable when you want to emphasize site accessibility and interpret results in the context of site chemistry and structure. It may highlight differences that a very small probe does not, especially in materials where diffusion limitations or pore structure effects are expected.
To make comparisons defensible, standardize the variables that most often change outcomes: adsorption temperature/time, purge conditions, ramp rate, sample mass, and pretreatment history. This makes differences in the curve far more likely to reflect real material changes.
Ammonia (NH₃) is the most commonly used probe due to:
Small kinetic diameter (0.26 nm), allowing access to virtually all acid sites
Strong adsorption on sites of varying strength
Thermal stability over a broad temperature range
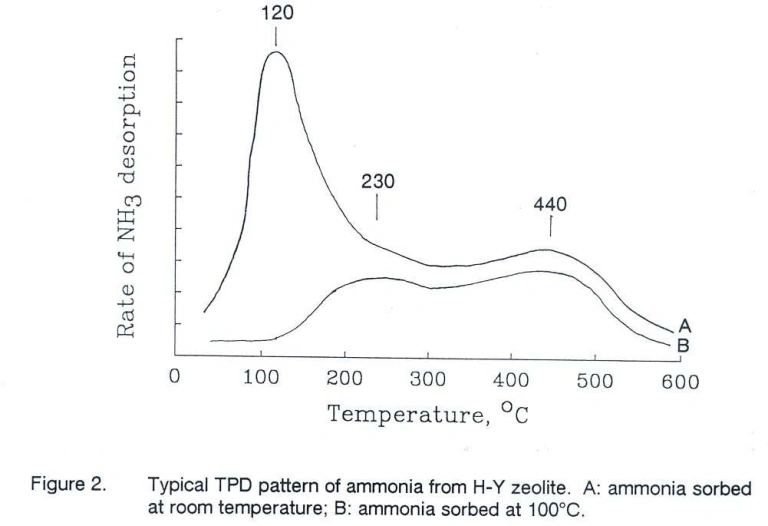
<150°C: Physically adsorbed ammonia (physisorption). This signal can be minimized by conducting adsorption at elevated temperatures (∼100°C).
200–500°C: Chemisorbed ammonia on acid sites. Multiple peaks may appear, reflecting a distribution of acid strengths.
These regions are general guidelines; actual peak positions depend on zeolite type, pretreatment, and adsorption conditions.
Use this breakdown to separate physisorption artifacts from chemisorbed acidity when comparing samples.
Literature Example
Published NH₃-TPD studies show how framework changes (e.g., Si/Al ratio) can shift peak intensity and temperature—useful for benchmarking trends.
Zi et al. (1) observed that increasing the Si/Al ratio in H-Y zeolites resulted in a stronger high temperature desorption peak, indicating a higher number of acid sites.
Shakhtakhtinskaya et al. (2) correlated desorption signals between 600–900 K (327–627°C) to
Brønsted acid sites, which disappeared upon dehydroxylation.
Treat these as trend references; always compare samples using the same run conditions
TPD results become more actionable when you translate them into the questions a lab team is actually trying to answer—such as activity, selectivity, or stability.
What to check when linking TPD to performance:
Site density vs strength: is activity driven by more sites or stronger sites?
Selectivity tradeoffs: stronger acidity can increase side reactions
Stability/deactivation: high acidity can accelerate coking in some chemistries
Higher-temperature desorption features can correlate with stronger sites that may support certain reactions, but they can also increase risks like unwanted side reactions or faster deactivation—depending on the chemistry. Interpreting the curve alongside reaction data is often more useful than treating acidity as a “higher is always better” metric.
There is no universal “best” curve. Many teams use NH₃-TPD to confirm whether a synthesis or treatment step moved acidity in the intended direction—then validate the outcome using catalytic metrics such as conversion, selectivity, or stability trends.
If you’re running NH₃-TPD for repeatable comparisons across multiple zeolite samples, instrument control over gas handling, ramp rate, and detection matters—see AMI’s chemisorption analyzers for TPD
For H-Y zeolites, the highest ammonia desorption temperature correlated with the cracking activity of n-pentane, as shown by turnover frequency (TOF) data (3).

Figure 3. Correlation between n-pentane cracking activity (TOF) and the highest ammonia desorption temperature.
Alternative Probe Molecules
While ammonia is versatile, other probe molecules offer advantages in selectivity and sensitivity to acid site type.
Pyridine
Adsorbs on both Brønsted and Lewis acid sites.
Allows differentiation using infrared (IR) spectroscopy (4, 5).
Adsorption parameters (temperature and time) are critical to ensure complete coverage, especially for larger pore zeolites like mordenite (6).
Other Probes
A variety of bases can be employed, chosen based on acid strength and pore accessibility.
Table 1. Common Probe Bases for Acidity TPD
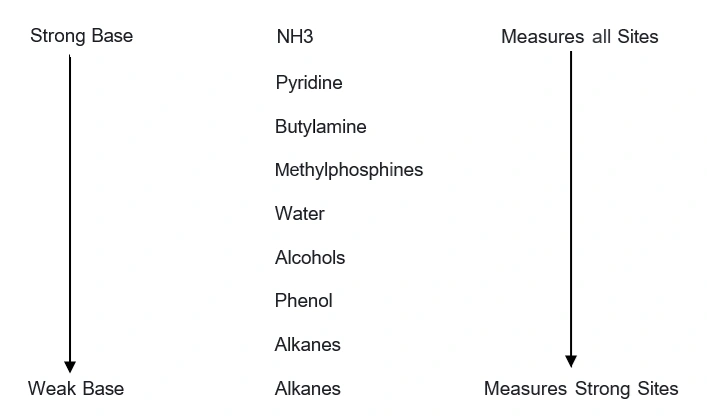
Note: Weak bases are generally used to probe only the strongest acid sites.
Practical Considerations
Adsorption Temperature: Elevated temperatures reduce physisorption artifacts.
Adsorption Time: Sufficient to ensure pore diffusion and full surface coverage.
Reaction Risk: For strong acid sites, probe molecules may undergo side reactions.
Selection should consider thermal and chemical stability.
Summary
Temperature-programmed desorption (TPD) of basic probe molecules is a powerful and flexible technique for characterizing the acidity of zeolites and related materials. By selecting the appropriate adsorbate and optimizing adsorption conditions, users can reliably quantify both the number and strength of acid sites—critical parameters that directly influence catalytic performance.
All AMI chemisorption analyzers are equipped to perform these TPD experiments with precision. Whether using ammonia for total acidity measurements or larger probe molecules like pyridine to selectively assess stronger or Brønsted versus Lewis acid sites, AMI systems offer the flexibility and control required for high-quality acidity analysis.
With robust temperature programming, sensitive detection options, and easy-to-use software, AMI’s chemisorption product line enables researchers and catalyst developers to accurately measure acidity and apply these insights to optimize catalyst design, performance, and longevity.
If you want to translate NH₃-TPD results into a repeatable workflow—especially when comparing multiple samples—instrument configuration details matter (gas handling, temperature control, detector choices, and automation).
To discuss a TPD-ready configuration that fits your lab workflow, contact AMI for a TPD-ready configuration or quote.
