Explore how silver powder specific surface area impacts photovoltaic silver paste performance. Detailed analysis of particle size, surface area, and solar cell efficiency.
Heterogeneous catalysis is integral to a wide array of industrial applications, including energy, chemical synthesis, and consumer products. Traditionally, a solid or powder catalyst is employed to transform gas phase hydrocarbons into valuable products. Elemental carbon deposition onto the catalyst, or “coking,” is an undesirable side reaction that, over time, will block the catalytic sites and deactivate the catalyst. Therefore, characterization of carbon deposits is essential for improving catalyst performance. Today, advanced techniques such as transmission electron microscopy (TEM), laser Raman spectroscopy, electron energy loss spectroscopy (EELS), solid-state ¹³C NMR, and temperature-programmed oxidation (TPO) are widely used to study coked catalysts. Among these, TPO has become one of the most commonly applied methods due to its simplicity and effectiveness.¹
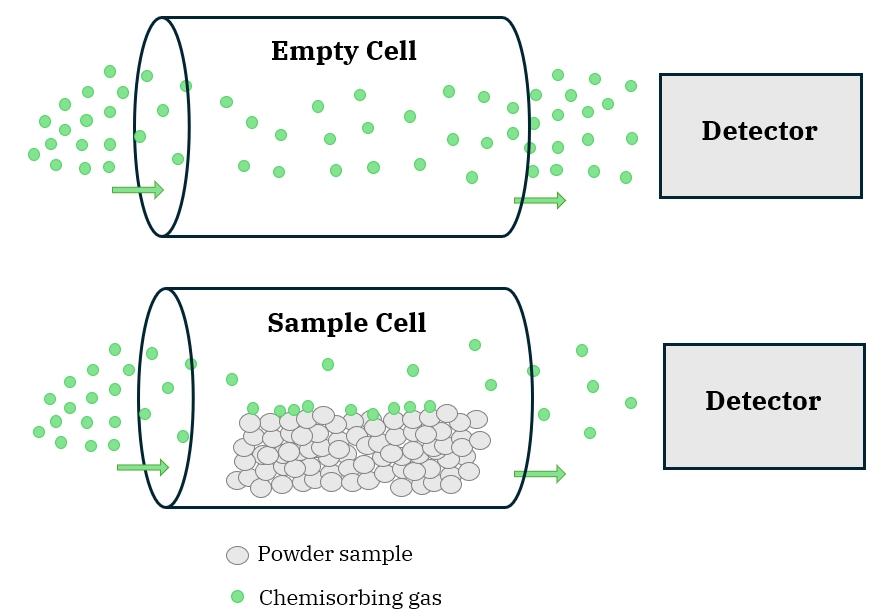
Temperature-programmed oxidation (TPO) is a materials characterization technique in which the sample is exposed to oxidizing gas, and the oxidizer chemically binds (chemisorbs) onto the surface. As the material temperature is increased, the oxidized surface species desorb from the material and are analyzed by a detector. For coke analysis, the catalyst is heated under O₂ flow, and surface carbon is oxidized to CO₂. The amount of desorbed CO₂ is directly related to the amount of coke, and the temperature at which CO₂ desorbed can differentiate between types of carbon on the catalyst. Typically, the desorbed product is analyzed by a thermal conductivity detector (TCD) or flame ionization detector (FID), but neither detector is sufficiently sensitive to CO₂. Therefore, a methanation step can be employed to convert CO₂ into CH₄, which is easily measured by a flame ionization detector (FID). This process is shown in Scheme 1.
This AMI Note discusses the use of TPO combined with an innovative detection method developed by Dr. S.C. Fung and Dr. C.A. Querini at Exxon Research and Engineering Company.² This approach is straightforward and enables continuous monitoring of the rate of coke oxidation.
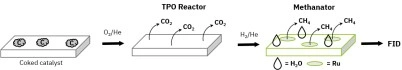
Scheme 1. Step-by-step process for detection of coke through sequential temperature-programmed oxidation (TPO) and methanation using an AMI catalyst characterization system equipped with a methanator and FID.
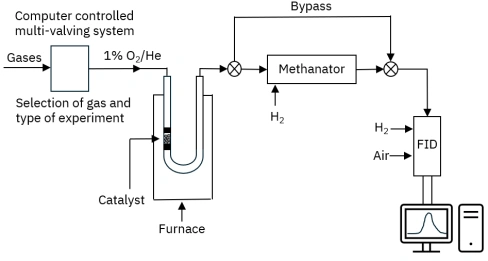
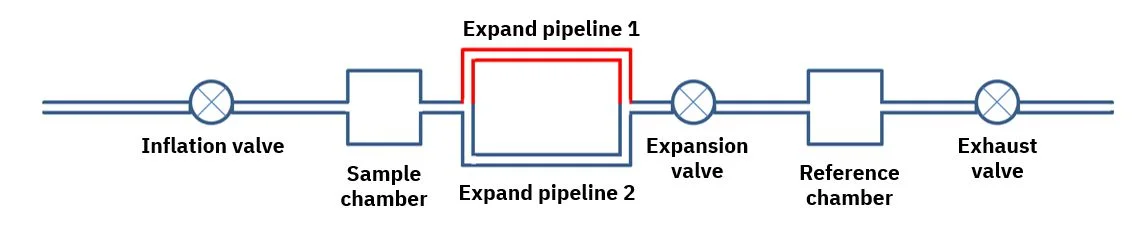
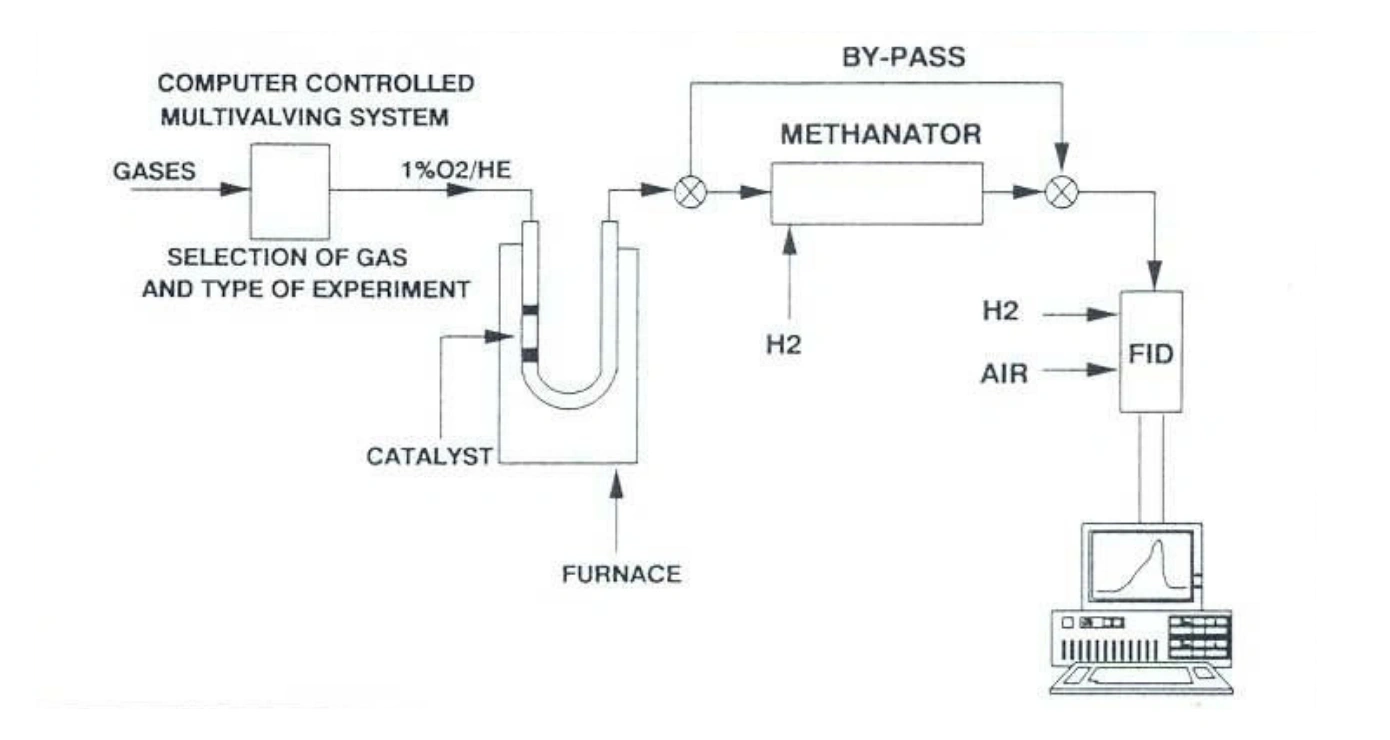
Figure 1: System flow diagram for AMI catalyst characterization system equipped with temperature-programmed oxidation (TPO) flow reactor, methanator, and FID
AMI is currently the only company to offer customizable catalyst characterization systems capable of such advanced TPO techniques.
Since TPO experiments require an excess of oxygen, it was necessary to evaluate how oxygen concentration in the gas stream affects the methanation of CO₂ to establish optimal operating conditions. The effects of flow rate and methanator temperature on the hydrogenation efficiency of the ruthenium catalyst were also investigated, along with the impact of various pretreatments on the Ru catalyst’s activity.

To study the influence of oxygen concentration on CO₂ methanation, pulses of 1%, 2%, and 4.26% CO₂ in helium were introduced into the methanator using helium carriers containing 0%, 0.5%, 1%, and 3% oxygen. As shown in Table 2:

✓ The CO₂ pulses were completely converted to CH₄ except when the oxygen concentration was increased to 3%.

One possible explanation for this behavior is that water formed in the methanator (due to the oxygen present in the carrier gas) reduced the equilibrium conversion of CO₂ to CH₄ (Eqn. 1 and 2).²
Table 2. Results showing percent CO₂ conversion to CH₄ at varying  pulsed CO₂ and O₂ concentrations


Table 3. Results showing the influence of temperature on equilibrium CO₂ conversion  to CH₄ at varying pulsed CO₂ and O₂ concentrations.
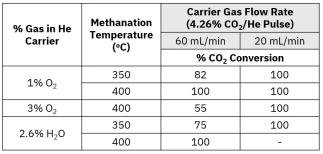
Higher oxygen concentrations lead to greater water formation, which in turn affects the equilibrium conversion of CO₂ to CH₄. Table 3 shows:

✓ TPO experiments should be conducted with oxygen concentrations at or below 3% and at methanator temperatures below 430 °C to avoid equilibrium limitations.

However, the incomplete conversion of CO₂ to CH₄ observed in Tables 2 and 3 may depend on other factors besides equilibrium limitations.

An alternative explanation is that water inhibits the methanation activity of the ruthenium catalyst. To investigate this, experiments were conducted varying three parameters: the oxygen concentration in the carrier gas, the methanator temperature, and the carrier gas flow rate, and the results are shown in Table 4. At 350 °C, increasing the flow rate of 1%O₂/He to 60 mL/min resulted in 82% CO₂ conversion, while lowering the flow rate to 20 mL/min increased the CO₂ conversion to 100%. At 400 °C the flow rate was no longer limiting, and both 60 mL/min and 20 mL/min rates achieved total CO₂ conversion to CH₄. At higher O₂ concentrations (3% O₂/He), the same trend emerged with only 55% conversion to methane at high flow rates (60 mL/min). Lowering the flow rate to 20 mL/min brought the CO₂ conversion back to 100%. Therefore:

✓ Higher O₂ concentrations require lower flow rates to maintain CO₂ conversion.
✓ Higher O₂ concentrations produce more water, and lower flow rates are necessary to reduce the total number of water molecules at a given time.

Experiments were also conducted by introducing water directly into the methanator by saturating the carrier gas at room temperature, producing a 2.6% water concentration in helium. This water level was comparable to that generated during oxidation in a 1.3% oxygen environment. A He pulse with 4.26% CO₂ was also introduced to the reactor. At 350 °C, the CO₂ conversion was largely unaffected by the water presence in the gas stream, showing 100% conversion to methane at lower flow rates (20 mL/min) and 75% conversion to methane at higher flow rates (60 mL/min). At 400 °C, the water-saturated CO₂/He reactant reached 100% conversion even at the higher, less optimal flow rate. These results confirmed previous findings that oxygen concentrations should ideally remain below 2%. For experiments requiring higher oxygen levels, an oxygen trap can be installed upstream of the methanator. These traps effectively remove oxygen without affecting the CO₂ concentration exiting the sample U-tube.
Table 4. Results showing the relationship between carrier gas flow rate and CO₂ conversion at varying O₂/H₂O concentrations and methanation temperatures.
Experimental results indicated that FID sensitivity increased linearly with carrier gas flow rates up to 60 mL/min. At higher flow rates, the FID response plateaued, suggesting that flow rates above this level do not further improve sensitivity. The sensitivity of FID and TCD to methane were compared in Figure 2. While the experimental data overlapped, the FID results were much more precise than the TCD.

An additional important observation was the deactivation of the ruthenium catalyst in the methanator due to sulfur poisoning. This deactivation was caused by sulfur oxides generated during the combustion of sulfur-containing coke deposits. The most effective solution was the installation of a sulfur oxide trap upstream of the methanator, which successfully removed sulfur contaminants without affecting the CO₂ concentration.
Figure 2: Plot comparing the sensitivity of CH₄ detection for two detectors: FID and TCD.
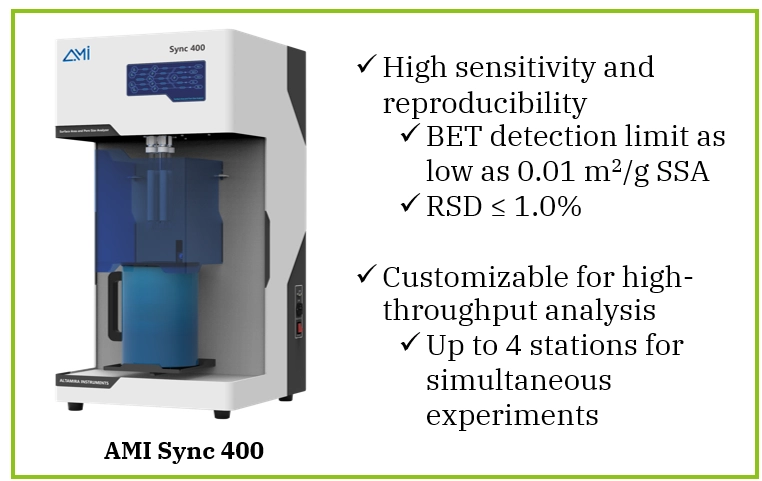
Figure 3: AMI chemisorption analyzers for catalyst characterization