Building on our previous overview of SSITKA (Steady-State Isotopic Transient Kinetic Analysis), this article delves into the core principles and computational methods behind […]
The schematic diagram of the SSITKA experimental setup is shown in Figure 1 [1]. It consists of three main components: a gas flow control system, a reactor, and a mass spectrometer. The gas flow system must support steady-state transient operation, enabling rapid and stable switching between isotopic feeds. It is also essential that both the pre- and post-switch conditions are well-defined and reproducible. The mass spectrometer must be capable of fast response to accurately capture transient signals.
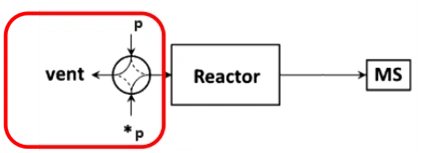
Figure 1 Schematic Diagram of SSITKA Experimental Device
Most SSITKA experiments today rely on microreactor-based systems that are either manual or semi-automated, often leading to operator-induced variability. The AMI 300TKA system addresses this challenge by enabling fully integrated SSITKA experiments through dedicated gas circuit design and coupled mass spectrometry, as shown in the software interface in Figure 2. Transient switching is achieved using a four-way valve, which alternates between two feed streams: Aux Gases and Blend Gases. These streams introduce either the unlabeled reactant (12CO) or the isotopically labeled reactant (13CO). Upon valve switching, the system seamlessly transitions from 12CO to 13CO under steady-state conditions.
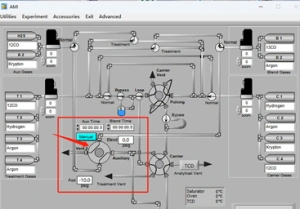
Figure 2 Software Interface of AMI 300TKA
SSITKA experiments can be executed automatically following the program shown in Figure 3. The fully automated process eliminates the need for manual intervention, significantly reducing the risk of human error and improving the accuracy and reproducibility of test results. The procedure is both practical and user-friendly, ensuring reliable operation even for complex transient kinetic studies.
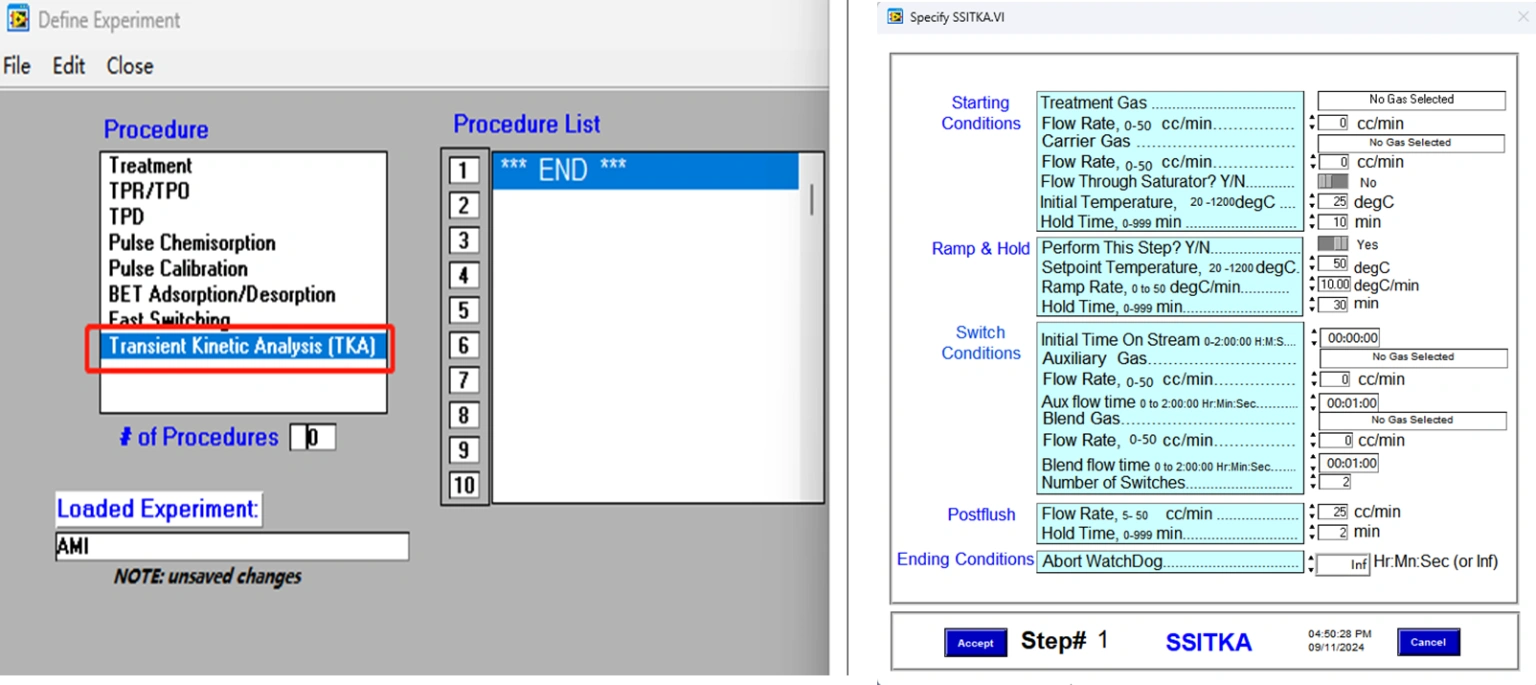
Figure 3 Kinetic Parameter Solving of SSITKA Program Setting of SSITKA on AMI 300TKA
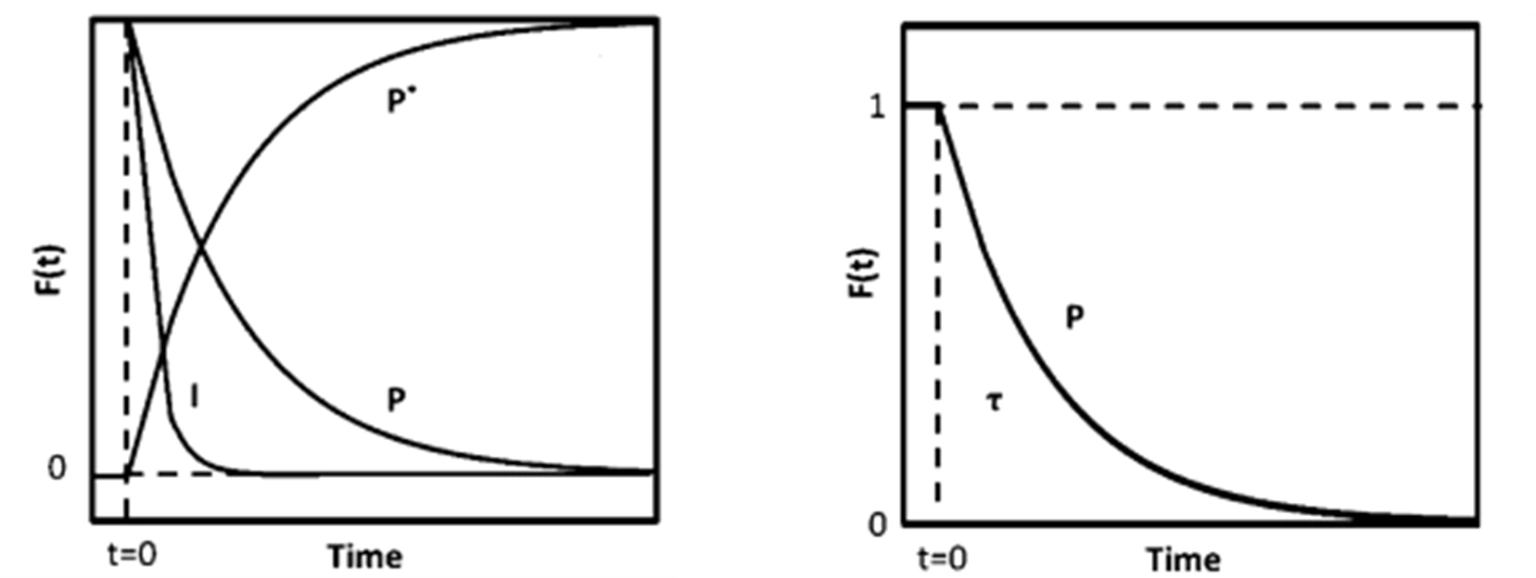
Figure 4 (a) Mass Spectrum (b) Transient Response Curve
Without making kinetic assumptions or defining surface reaction mechanisms, two key parameters can be directly extracted from the transient response curve: the surface residence time (or surface lifetime) τₚ of the intermediate species that form product P, and the surface coverage Nₚ of those intermediates. The expression for calculating N
